How to Compare Insurance Solutions for Faster Growth

Buying new insurance technology is rarely a “feature checklist” problem. For carriers, MGAs, brokers, and claims teams, the real goal is faster decision-making at scale: quoting and binding sooner, servicing policies with fewer touchpoints, and closing claims with less friction.
That is why the best way to compare insurance solutions is to start with a simple question: what are you trying to do with your data right now?
When you anchor evaluation to the job-to-be-done (and the interface that makes that job fast), vendor comparisons get clearer, pilots get shorter, and growth projects stop stalling in “analysis paralysis.”
Step 1: Compare solutions by the job you need to accomplish
Most teams evaluate “insurance solutions” as if one UI or one workflow style should fit everything. In practice, there are four common jobs, and each tends to require a different working surface.
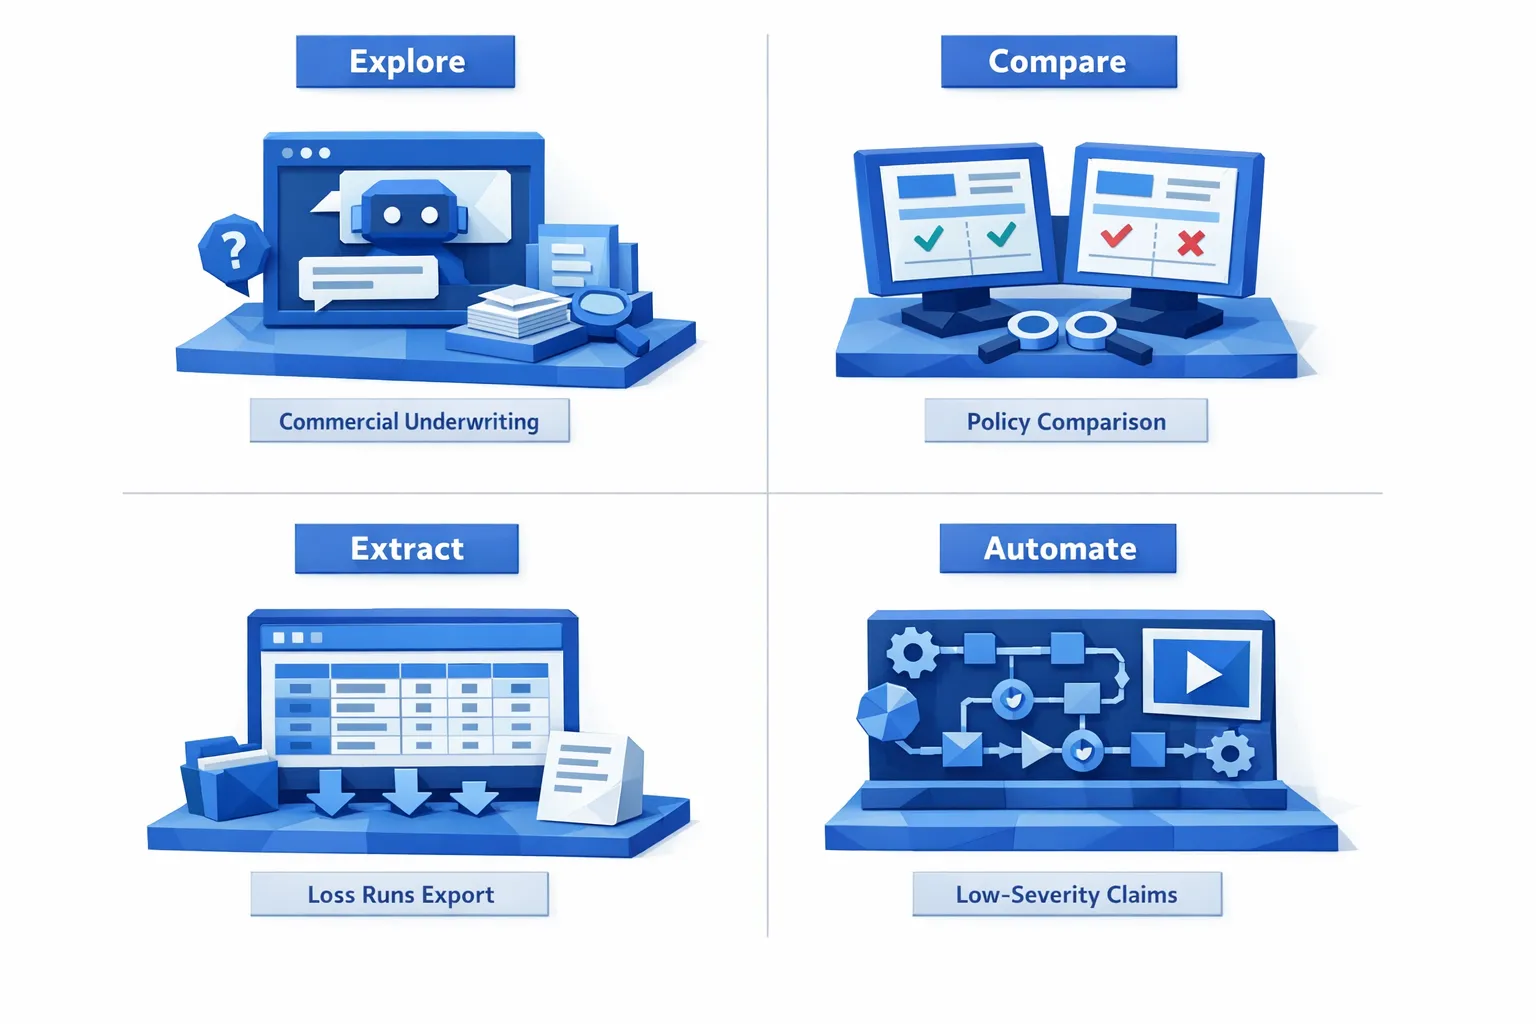 commercial underwriting, policy comparison, loss runs export, and low-severity claims." />
1) Explore data: a chat interface is best
When the work is exploratory, a chat interface usually wins. Think commercial underwriting where the underwriter is trying to understand a risk quickly, ask follow-up questions, and navigate messy documentation.
What to look for when comparing solutions for “explore” use cases:
- The system can answer questions grounded in the underlying documents and structured fields (not just generate plausible text).
- It can cite where an answer came from (document section, extracted field, source system).
- It can handle insurance-specific terms and workflows without constant prompt engineering.
Where teams go wrong: buying a generic “chatbot” that feels impressive in demos but cannot reliably trace answers back to auditable data. In regulated workflows, “helpful” is not enough. You need traceability and consistent outputs.
2) Compare data: a side-by-side workbench is best
When your work is comparative, a side-by-side workbench is usually best. Examples include policy comparison during endorsements, renewal review, coverage validation, or broker negotiations.
What to look for:
- True side-by-side diffing that highlights changes and mismatches (limits, deductibles, endorsements, named insured details).
- Consistent normalization so “GL aggregate” and “general liability aggregate” are treated as the same concept.
- Review tools that speed decisions (approve, route, request info) without forcing users to open five systems.
Where teams go wrong: forcing comparative tasks into a single-document viewer or a chat tool. Chat is good for exploration, but comparison is about precision and visibility.
3) Extract data: a tabular view is best
When you need to extract data, a tabular view is best. Loss runs, bordereaux, invoice line items, fleet schedules, and exposure data often end up in Excel or downstream systems.
What to look for:
- A fast way to validate extracted fields at scale (not row-by-row misery).
- Clear handling of exceptions (missing values, mismatched totals, non-standard formats).
- Export and integration options that match your operating reality (file-based, API-based, or both).
Where teams go wrong: ignoring QA and reconciliation. Extraction that is “90% accurate” but not reviewable can be worse than manual, because it introduces hidden errors.
4) Automate data: a workflow view (command center) is best
When you need to automate data handling, you want a workflow command center. This is ideal for high-volume processes like non-standard auto underwriting triage or low settlement amount claims.
What to look for:
- Workflow orchestration (routing, SLAs, escalations, and exception handling).
- Human-in-the-loop controls for edge cases.
- A clear audit trail (what happened, when, why, and which data drove the decision).
Where teams go wrong: treating automation as a one-off script. Growth requires operationalization, monitoring, and continuous improvement.
Step 2: Define “faster growth” in measurable operational terms
If your evaluation criteria are vague (“modern,” “AI-powered,” “automated”), every vendor will look the same. Before you compare, write down what growth requires in your context.
In P&C operations, faster growth typically translates into one or more of the following:
- Faster quote turnaround time (especially for complex or non-standard submissions)
- Higher quote-to-bind conversion (reduced quote abandonment)
- Lower expense ratio (fewer manual touchpoints per policy or claim)
- Better loss ratio through cleaner inputs and fewer underwriting misses
- Faster claims cycle times for low-severity, high-volume segments
A practical way to keep evaluation honest is to pick one primary metric and two supporting metrics for your initial rollout. The primary metric is what you report to leadership. The supporting metrics help you diagnose why results move.
Step 3: Compare insurance solutions using eight criteria that actually predict outcomes
Once you know whether you are exploring, comparing, extracting, or automating, you can evaluate vendors against criteria that correlate with speed, scale, and long-term value.
1) Interface fit: does the UI match the job?
Ask vendors to demo your real workflow in the right surface:
- Explore: how does the user ask questions and verify answers?
- Compare: how does the user spot differences in seconds?
- Extract: how does QA work for 500 rows, not 5?
- Automate: how do exceptions route, and what does monitoring look like?
If the interface does not match the job, adoption suffers, even if the underlying AI is strong.
2) Data intake reality: can it handle your messy inputs?
Insurance teams live in a multi-format world: PDFs, emails, spreadsheets, photos, portals, and legacy exports.
Compare solutions by their ability to:
- Support all relevant file types and intake channels
- Normalize fields across different document templates
- Preserve source context so decisions remain auditable
A good reference point for data management practices is the NAIC model laws and guidance environment your compliance teams already operate in, even when you are not building directly “for NAIC.”
3) Integration: can it plug into your stack without a rebuild?
“Seamless integration” is often marketing language, so make it concrete.
In vendor comparisons, ask:
- Which core systems have you integrated with before (policy admin, claims, CRM, DMS, data lake/warehouse)?
- Do you support API-based enrichment and event-driven workflows?
- What is the plan for identity, permissions, and audit logs?
4) Automation design: can you deploy and change workflows quickly?
High-growth teams need to adjust workflows as underwriting appetite shifts, fraud patterns evolve, or new regulatory constraints appear.
Compare solutions by:
- How quickly a workflow can go from idea to production
- Whether business users can configure workflows (with governance) or whether every change requires engineering
- Whether the workflow supports exception handling and human approvals
5) Data warehouse and analytics: do you get visibility, not just automation?
Automation is the beginning. The larger payoff is what you learn from the data you are structuring.
Evaluate:
- Whether the platform captures structured outputs from workflows into a unified data layer
- Whether dashboards and reporting can be built without weeks of custom ETL
- Whether you can track performance over time (accuracy, cycle time, leakage indicators)
This is also where you can compare vendors on their ability to support operational BI and portfolio narratives, not just task completion.
6) Explainability and auditability: can you defend decisions?
In insurance, “the model said so” is not a valid explanation.
When comparing solutions, look for:
- Decision logs, data lineage, and versioning
- Human-readable reasons for automated decisions (and what data drove them)
- Controls for bias monitoring and governance
For a structured way to think about AI risk and controls, the NIST AI Risk Management Framework is a useful baseline.
7) Security and privacy posture: can it meet procurement scrutiny?
You do not need to become a security auditor, but you should compare vendors on readiness signals:
- Clear data retention options
- Role-based access controls and least-privilege design
- Support for enterprise security reviews
If your organization aligns to standards like ISO/IEC 27001, map vendor answers to the controls your security team already expects.
8) Time to value: can you prove impact without a six-month runway?
Growth projects die when they require long PoCs and constant back-and-forth.
Compare:
- How quickly you can get a production-ready workflow running with your data
- What the vendor needs from your team (engineering time, data mapping, retraining)
- Whether there are reusable workflow templates relevant to your line of business
Step 4: Run a comparison pilot that reveals the truth
A good pilot is not “let’s test the AI.” It is “let’s test the workflow outcome.”
Keep it small, but realistic:
- Pick one high-frequency process with clear success metrics (example: loss run extraction and export, or low-severity claims triage).
- Bring messy, representative inputs (including edge cases).
- Define pass/fail criteria before the vendor demo.
- Measure the full path, not just one step: intake, extraction, QA, routing, integration handoff, audit trail.
If your pilot does not include exceptions, you are not piloting. You are watching a happy-path demo.
Step 5: Avoid common comparison traps that slow growth
Trap 1: Buying “one interface to rule them all”
Most teams need multiple surfaces: chat for exploration, workbench for comparison, tables for extraction, and workflows for automation. If a tool forces everything into one paradigm, productivity suffers.
Trap 2: Overvaluing accuracy claims without operational QA
Accuracy matters, but in insurance workflows, reviewability and exception handling are what make automation usable at scale.
Trap 3: Treating integration as an afterthought
If the tool cannot push outputs into your systems (or cannot do it securely), your team will recreate manual workarounds, and cycle time improvements evaporate.
Trap 4: Ignoring benchmarking and portfolio narratives
Faster growth is not just internal efficiency. It is also external leverage: renewals, reinsurance negotiations, and broker conversations benefit from credible narratives about performance vs the market.
Where Inaza fits when you are comparing insurance solutions
If you are evaluating platforms to accelerate underwriting, claims, and operations, Inaza is designed around the practical reality described above:
- Deploy workflows quickly without the prolonged PoC back-and-forth that slows procurement and rollout.
- Capture structured data into a unified warehouse, so automation outputs become business intelligence, not just one-off task completion.
- Enrich automations using pre-built API templates (including common insurance data providers) to improve decision quality without heavy integration lift.
- Use built-in industry benchmarks to understand performance vs the market and support clearer portfolio narratives.
You can explore Inaza’s platform approach at inaza.com, and if you are actively comparing options, it is worth pressure-testing with a real workflow and real inputs.
Frequently Asked Questions
What is the best way to compare insurance solutions without wasting months? Start by defining the job (explore, compare, extract, automate), pick one measurable process, then run a pilot that includes exceptions and end-to-end handoffs.
Should we prioritize a chat interface for underwriting? Only for exploratory work. If your team needs side-by-side comparison (renewals, endorsements, coverage checks), a workbench is usually faster and less error-prone.
How do we evaluate AI accuracy in insurance operations? Do not rely on a single accuracy number. Evaluate reviewability, exception handling, audit trails, and performance on messy edge cases, because those determine real cycle time impact.
What features matter most for scaling automation across underwriting and claims? Workflow orchestration, integration into core systems, explainability, and a unified data layer for reporting are the consistent predictors of scale.
Why does a data warehouse matter when buying automation software? Automation outputs become significantly more valuable when they are captured into a unified data layer, enabling analytics, monitoring, and continuous improvement across teams.
CTA: Compare faster by testing the right interface for your workflow
If your goal is faster growth, do not start by asking, “Which vendor has the most AI features?” Start by asking, “Which workflow do we need in production, and what interface makes it fast?”
To see what that looks like with real insurance inputs, explore Inaza’s AI-powered automation platform and request a workflow walkthrough at Inaza.