Data Analytics in Insurance Industry That Actually Changes Decisions

Here’s my unpopular opinion after a decade around insurance operations: most dashboards are expensive mood lighting.
They glow. They impress visitors. They create a healthy amount of meeting theater. Then the underwriter still opens the same spreadsheet, the adjuster still asks the same three people for an update, and the fraud analyst still gets a queue full of false positives.
That is not data analytics changing the business. That is reporting with better colors.
Data analytics in the insurance industry only matters when it changes a decision. Did we price differently? Route a claim differently? Ask for fewer documents? Escalate a bodily injury demand faster? Decline a suspicious submission earlier? Re-negotiate a reinsurance treaty with a cleaner portfolio story? If the answer is no, we have made a dashboard, not an operating advantage.
And the timing matters. A perfect insight delivered two weeks after bind is a museum exhibit. A good enough signal delivered before referral, settlement, renewal, or payment is worth real money.
The real test: what decision changed?
The first question I ask when someone shows me an insurance analytics dashboard is annoyingly simple: who is supposed to do what differently because of this?
If there is no owner, no threshold, and no workflow trigger, the chart is probably decoration.
I once sat in a claims review where a beautiful dashboard showed a rising spike in late-cycle bodily injury escalation. Everyone nodded. Someone said, interesting trend. Then the meeting moved on. No routing rule changed. No attorney demand workflow changed. No reserve review cadence changed. That chart could have been a painting of a lighthouse for all the impact it had.
A decision-grade version would have said: claims with these injury descriptions, treatment patterns, venue signals, and attorney identifiers should be routed to a senior adjuster within 24 hours. It would have logged whether that routing happened, tracked the outcome, and fed the next review.
That is the gap between analytics as commentary and analytics as control.
Start with the verb, not the visualization
Insurance teams love nouns: dashboard, report, model, score, lake, warehouse. Useful, sure. But the work happens through verbs: accept, refer, decline, price, settle, reserve, investigate, renew, staff, escalate.
So the practical starting point is not: what can we analyze? It is: which decision is currently expensive, slow, inconsistent, or too dependent on someone remembering the rule at 5:47 p.m. on a Friday?
For MGAs, that might be quote referral logic. For carriers, it might be claims triage or fraud leakage. For brokers, it might be which submissions are worth remarketing. For reinsurance brokers, it might be portfolio narrative and benchmark defensibility. For claims adjusters and SIU teams, it might be deciding which claim needs human attention today rather than next Tuesday.
This sounds obvious, but it is where many analytics programs wobble. They begin with the data available instead of the decision needed. That is how teams end up with seventeen views of quote count and zero ability to explain why bind rate is dropping in one segment.
Underwriting analytics should protect underwriter attention
Underwriters are not short on data. They are short on clean, timely, decision-ready data.
McKinsey has estimated that underwriters can spend up to 60 percent of their time on administrative work rather than actual risk assessment. Anyone who has watched an underwriter copy fleet data from a PDF into a rating tool knows this is not a theoretical problem. It is Tuesday.
The best underwriting analytics does not create more things to inspect. It narrows attention. It shows which submissions can move straight through, which need enrichment, and which should be referred because the risk has changed in a way the file does not make obvious.
A simple example: a commercial auto submission shows a clean loss run and a reasonable vehicle schedule. Fine. But enriched vehicle data shows title irregularities, garaging inconsistency, or a usage pattern that does not match the stated class. That should not sit passively in a dashboard. It should trigger a verification step, change the referral path, or adjust rating assumptions before bind.
Another example I have seen in the wild: an MGA had a quote abandonment problem. The dashboard said abandonment was high. Helpful? Barely. The useful version showed that abandonment was concentrated around a specific data request that brokers did not have at submission time. The decision changed from pushing brokers harder to redesigning the intake flow and deferring that data requirement until a better moment. Same data, different outcome.
This is where connected workflows matter. If underwriting analytics live outside the submission process, they become homework. If they sit inside the workflow, they become a guardrail.
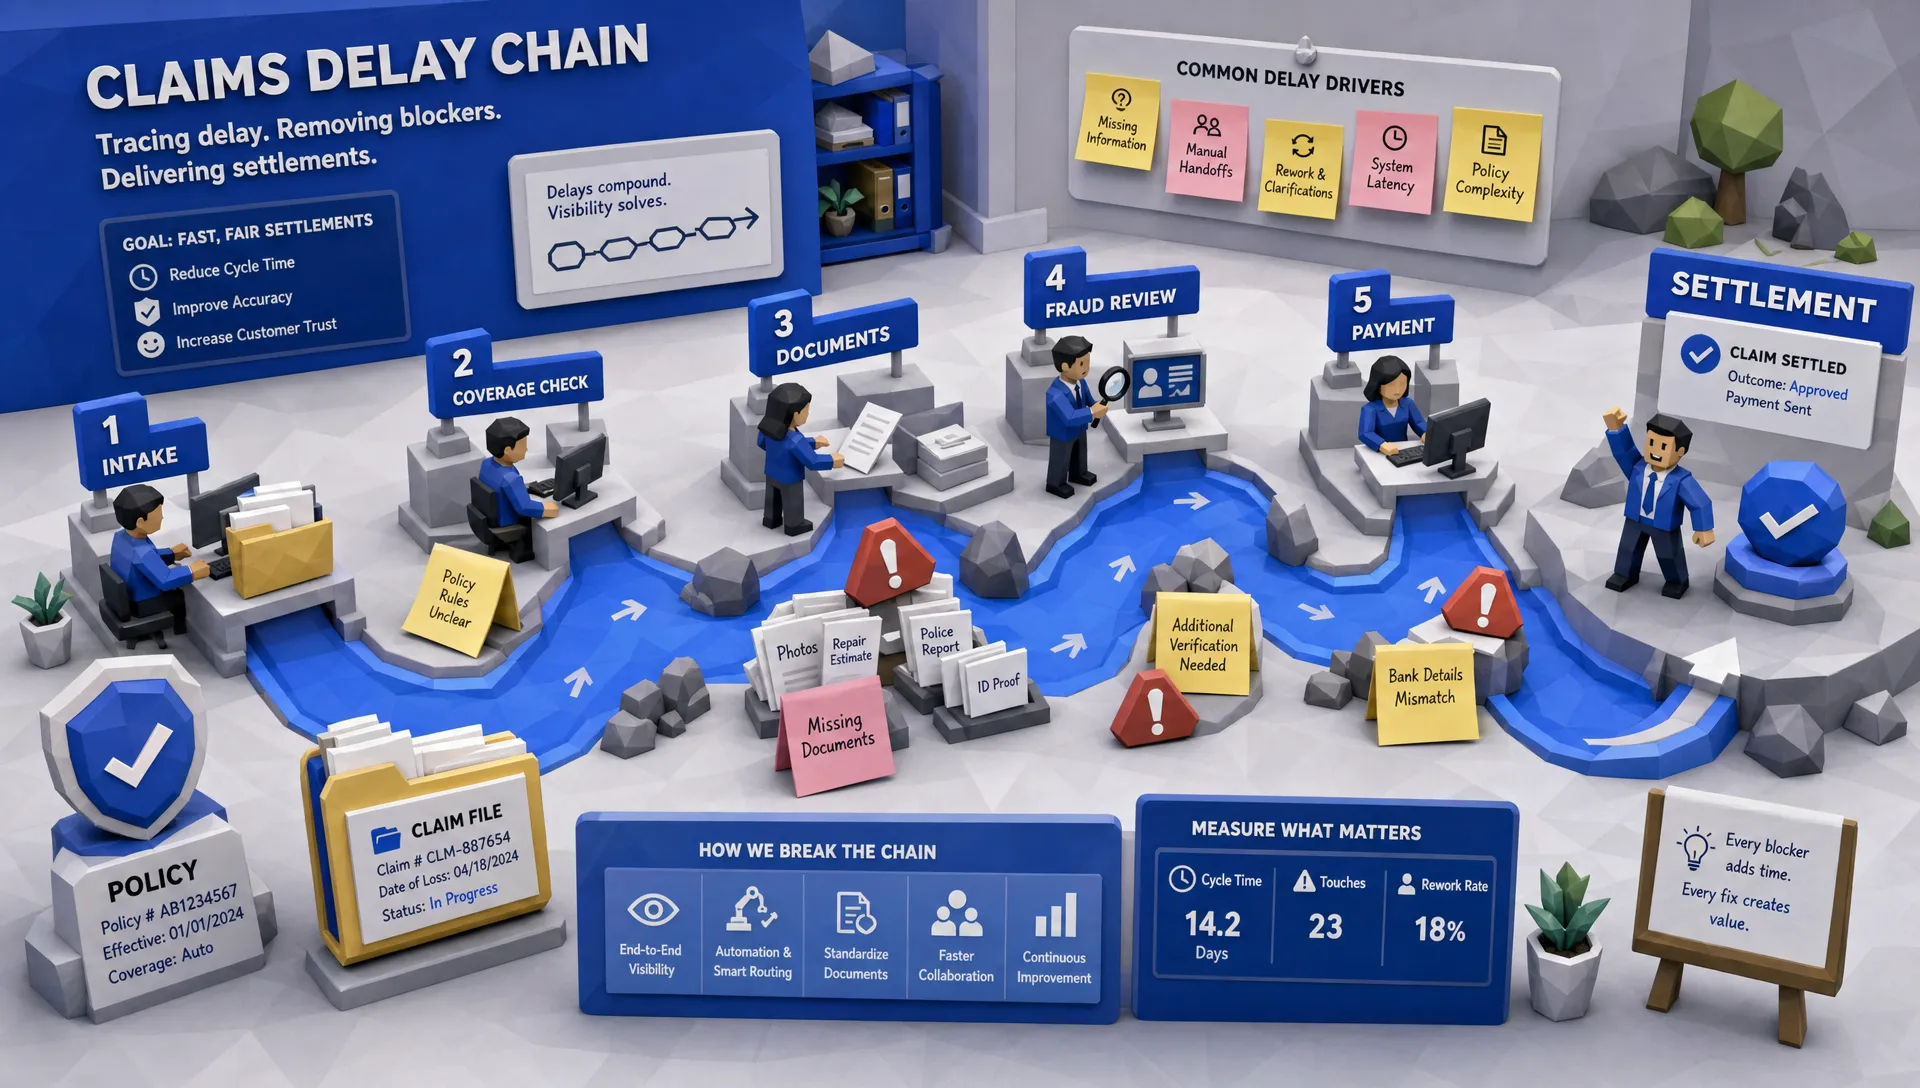
Claims analytics should reduce uncertainty early
Claims teams already know that speed matters. The policyholder definitely knows it. Nobody files a claim hoping to experience a thoughtful tour of internal handoffs.
J.D. Power’s 2024 U.S. Auto Claims Satisfaction Study noted that auto claims still often take more than 30 days to settle. That is a long time for a customer who just wants their car repaired, their rental sorted, and one fewer thing to worry about.
Decision-changing claims analytics should act at FNOL, not only at month-end. It should help answer questions like: is this claim likely to be simple? Is coverage clear? Is the repair path obvious? Is there a bodily injury exposure? Is there attorney involvement? Is the claim likely to breach an SLA? Is there a fraud indicator that warrants review before payment?
I like the grocery-store dent example because everyone gets it. If a customer uploads photos showing a small bumper scrape in a supermarket parking lot, with consistent metadata, clear coverage, and no prior suspicious history, the claim should not take the same route as a multi-vehicle accident with injury, inconsistent photos, and a lawyer letter attached. Treating both the same is operational laziness wearing a compliance hat.
Good analytics separates the obvious from the complex. That means the adjuster spends more time on judgment-heavy claims and less time nudging routine files along like a shopping cart with a bad wheel.
Fraud analytics should protect analysts from noise
Fraud detection is where insurers can get intoxicated by scoring. A fraud score sounds decisive. In practice, a bad fraud score can bury SIU teams under alerts and annoy honest customers.
The fraud problem is very real. The FBI warns that non-health insurance fraud costs more than $40 billion per year in the U.S. And fraud tactics are changing quickly. Verisk’s 2025 fraud report reported that 98 percent of carriers believe AI is fueling digital fraud, while 55 percent of Gen Z respondents said they would consider using AI tools to fake a claim.
That should make every fraud leader sit up a little straighter.
But here is the catch: more alerts are not the answer. Better decisions are.
A useful fraud analytics setup does three things. First, it ranks the claim or submission by risk in context, not by a single weird field. Second, it explains which signals matter enough for a human to care. Third, it connects that signal to an action, such as requesting additional documentation, verifying image metadata, routing to SIU, or allowing the claim to continue without delay.
False positives have a cost. They slow down good claims, frustrate customers, and train frontline teams to ignore the system. The best fraud analytics should make SIU feel like they have a metal detector, not like someone dumped the entire beach into their office.
Operations analytics is where the money quietly hides
Executives often want analytics for underwriting and claims because those areas feel strategic. Fair enough. But some of the fastest gains come from operations.
Operations analytics answers the questions that sound boring until you put a dollar sign next to them. Where are we re-keying the same data? Which brokers send the most incomplete submissions? Which document types cause the most rework? Which queues will breach SLA in the next 48 hours? Which manual step creates the most avoidable touches?
This is where I think insurers underinvest. A policy operations team can know exactly where work is stuck, yet still lack authority or workflow tooling to fix it. That is painful. It is like seeing smoke from the kitchen and being told the fire extinguisher belongs to another department.
Customer-facing intake matters here too. If data comes through mobile FNOL, broker portals, or policyholder apps, the experience has to make clean data easy. Some insurers choose to work with specialists in mobile app development for that front-end experience, but the larger point is this: beautiful intake is only half the job. The information has to land in the right system, in the right format, with the right downstream action.
If operations analytics only tells you the backlog grew, it is late. If it predicts where backlog will grow and automatically changes routing, staffing, or escalation, it changes the business.
Portfolio analytics should help you tell a defensible story
At portfolio level, analytics becomes less about an individual transaction and more about appetite, profitability, and capital confidence.
This is where carriers, MGAs, and reinsurance brokers need more than pretty loss ratio charts. They need to explain why performance moved, which segments are improving, where exposure is drifting, and how current results compare with market benchmarks.
That last piece matters in renewal and reinsurance conversations. If you can show how your book compares against credible industry benchmarks, and explain the operational changes behind your results, you are in a stronger position. You are no longer saying, trust us, we feel good about this book. You are saying, here is the evidence, here are the cohorts, here is the trend, and here is how we are controlling the next underwriting year.
Inaza’s platform includes industry benchmark capabilities, including benchmarks associated with sources such as Aon, Munich Re, and Howden, to help users understand how their business compares with the market. That kind of context can turn portfolio analytics into a narrative for renewals, board discussions, and reinsurance negotiations.
The keyword is narrative. Numbers without a story are a spreadsheet. Numbers with trend, context, decision history, and market comparison are management material.
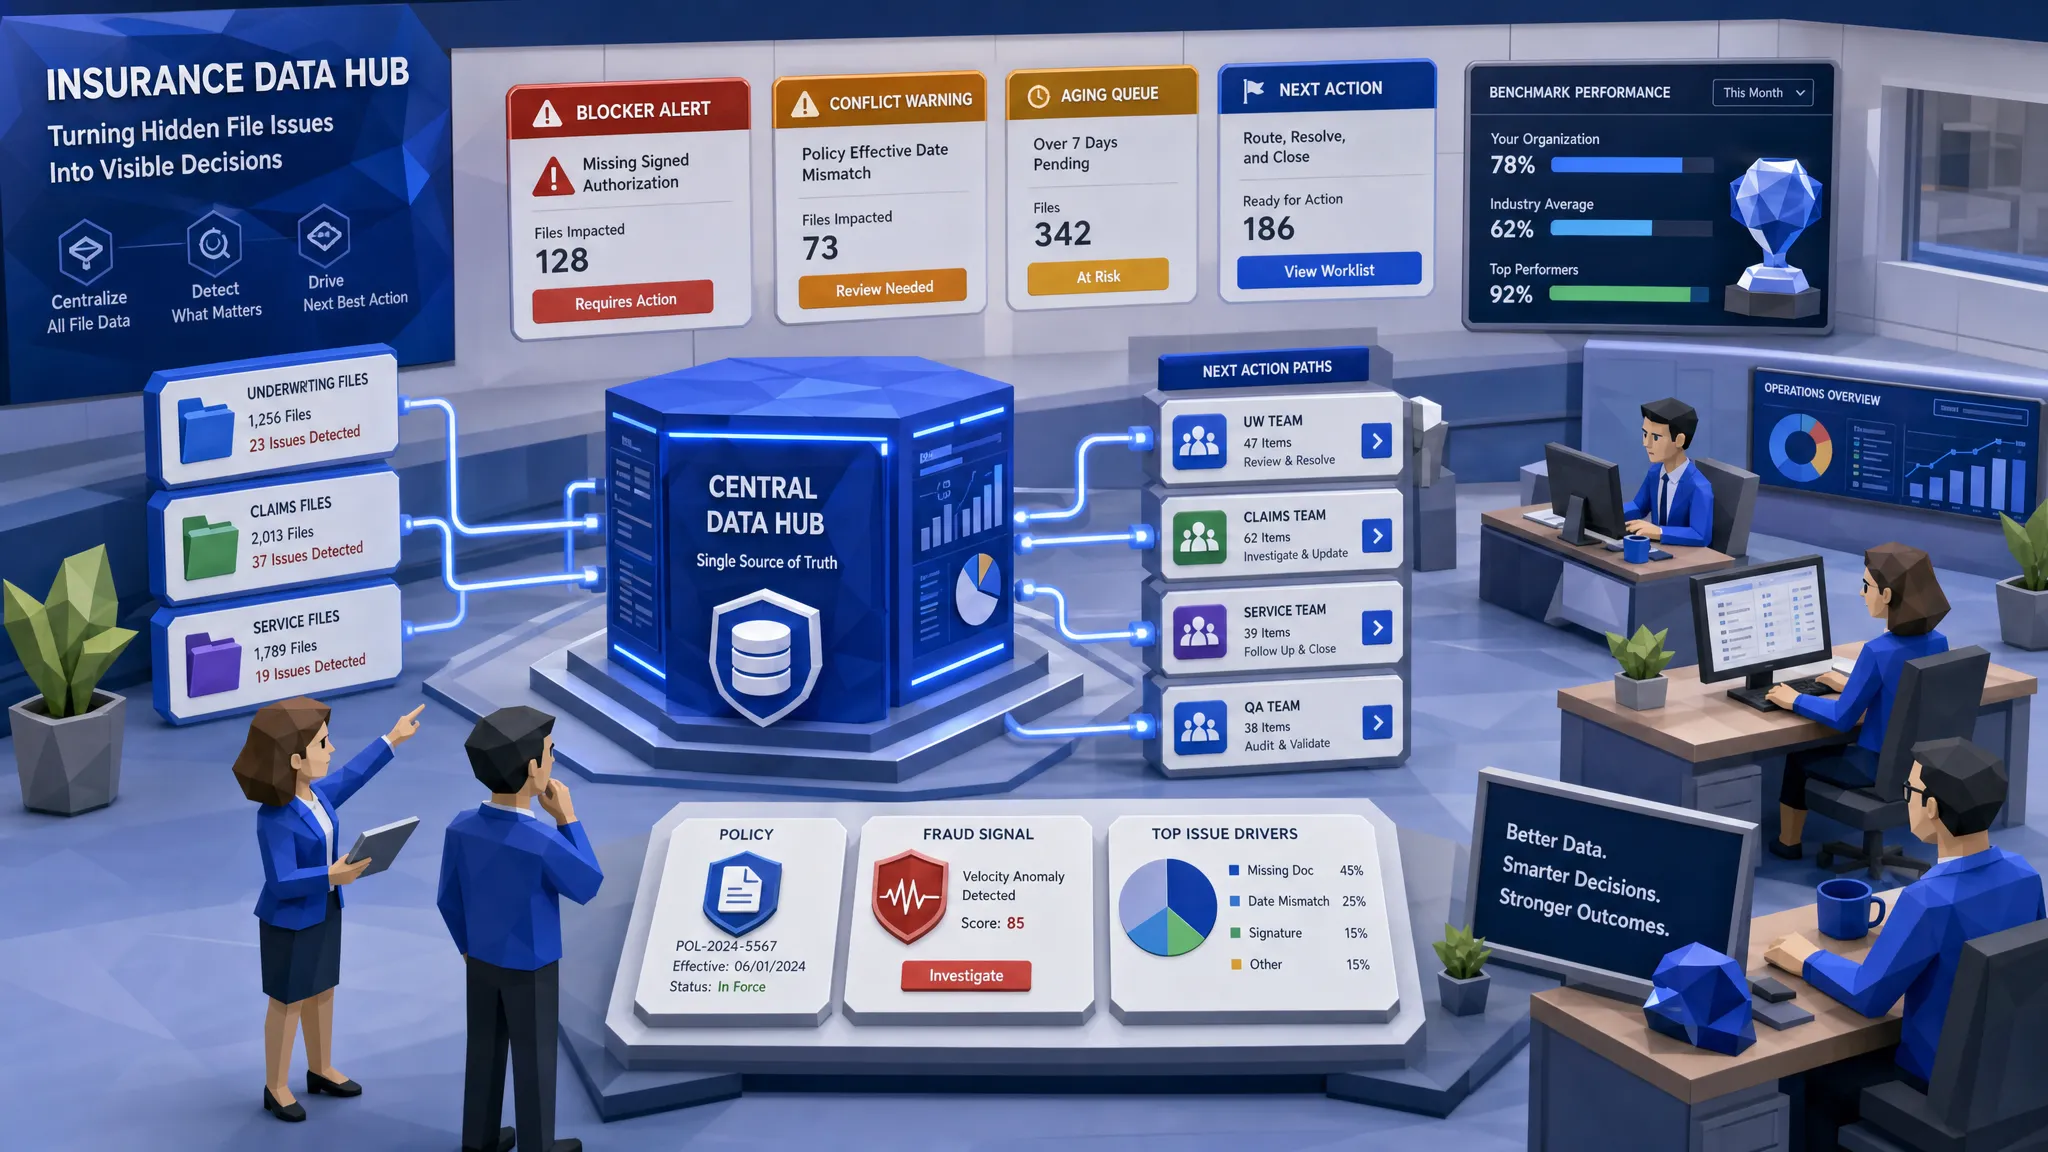
The boring hero: a data warehouse underneath the workflow
I know, data warehouse is not exactly cocktail-party conversation. But in insurance analytics, it is often the difference between useful and useless.
Workflow automation on its own can speed up tasks. Good. But if the platform does not capture what happened, when it happened, who touched it, what data was used, and what outcome followed, you lose the learning loop.
That is why a connected-data approach matters. Inaza’s platform is built with a unified data warehouse underneath the workflows, so automation can capture key data points and turn them into reporting, analytics, and business intelligence. That is important because the strongest analytics come from process data, not only policy and claim data.
Think about quote abandonment. A policy admin system might tell you a quote did not bind. Workflow data can tell you the quote stalled after a specific document request, sat with a specific queue, or failed after a third-party data check returned an exception. That is a very different level of usefulness.
If you want a deeper look at this operating model, Inaza has also written about how insurers can understand insurance risk better with a connected-data platform and how insurance software solutions can fix workflow bottlenecks.
The 2026 analytics mandate: move from insight to action
Insurance CEOs are not ignoring technology. Accenture has reported that many insurance leaders are investing heavily in AI for claims and underwriting. The problem is not interest. The problem is turning interest into production workflows that change decisions without asking teams to become part-time systems integrators.
My advice is deliberately unglamorous: pick one decision and wire analytics directly into it.
Choose something with measurable pain. A high-volume referral reason. A claim triage delay. An attorney demand queue. A fraud false-positive problem. A quote abandonment step. Then define the decision owner, the data required, the threshold for action, the workflow change, and the outcome metric. Run it weekly. Adjust it. Then scale.
This is where Inaza’s approach is practical. The platform integrates with existing systems, supports all file types, includes 250+ workflow templates, and has pre-built API templates for enrichment sources such as Verisk, LexisNexis, HazardHub, and others. Inaza is also designed so insurers can deploy their own workflows without the usual prolonged proof-of-concept loop, including production-ready workflow deployment with a user on a single call.
That matters because decision-changing analytics cannot live forever in discovery mode. At some point, the dashboard has to stop admiring the problem and start changing the work.
Frequently Asked Questions
What is data analytics in the insurance industry? Data analytics in the insurance industry is the use of policy, claims, customer, operational, and external data to improve decisions across underwriting, claims, fraud, customer service, and portfolio management. The key is turning analysis into workflow actions, not simply producing reports.
How can insurers tell if analytics is actually working? Look for changed decisions and measurable outcomes. Useful analytics should improve quote-to-bind rates, reduce manual touches, shorten claims cycle times, lower false positives, reduce leakage, improve SLA performance, or strengthen portfolio profitability. If nobody acts differently, the analytics is underpowered.
Does decision-grade analytics replace underwriters or adjusters? No. It should protect their time. The goal is to automate routine checks, surface risk signals earlier, and route complex work to the right people. Human judgment remains critical for nuanced underwriting, sensitive claims, litigation exposure, and exceptions.
Which data sources matter most for insurance analytics? It depends on the decision. Underwriting may use submission data, loss runs, MVRs, vehicle data, geospatial data, credit where permitted, and third-party enrichment. Claims may use FNOL data, images, invoices, medical documents, attorney correspondence, repair estimates, and fraud indicators. Operational analytics also needs workflow event data.
Why do many analytics projects fail to influence decisions? They often start with available data instead of a business decision. They also fail when insights arrive too late, lack clear ownership, sit outside the workflow, or do not track outcomes. Analytics has to be close to the moment of decision to matter.
Ready to make analytics operational?
If your dashboards are informative but your decisions still depend on manual chasing, spreadsheet archaeology, and hallway memory, it is time to tighten the link between analytics and workflow.
Inaza helps insurers, MGAs, brokers, claims teams, fraud analysts, and underwriters automate data capture, enrich workflows, and turn operational data into real-time dashboards and business intelligence. The aim is simple: faster decisions, cleaner data, fewer manual touches, and analytics that earns its seat at the table.
If you want data analytics that actually changes underwriting, claims, fraud, and portfolio decisions, talk to Inaza and see how a connected automation platform can fit into your existing insurance operations.