What Loss Run Insurance Data Tells Underwriters

Loss runs are one of the few underwriting artifacts that combine “what happened” (claims outcomes) with “how it happened” (timing, cause, handling, and development). That’s why loss run insurance data is often the fastest way for underwriters to validate a submission story, pressure test pricing, and decide where they need tighter terms or deeper investigation.
The challenge is that loss runs are frequently inconsistent across carriers, incomplete across years, or delivered as messy PDFs that slow decisioning. This guide breaks down what underwriters actually learn from loss runs, which fields matter most, and how to turn the same data into repeatable, auditable underwriting decisions.
What “loss run” data is (and what it is not)
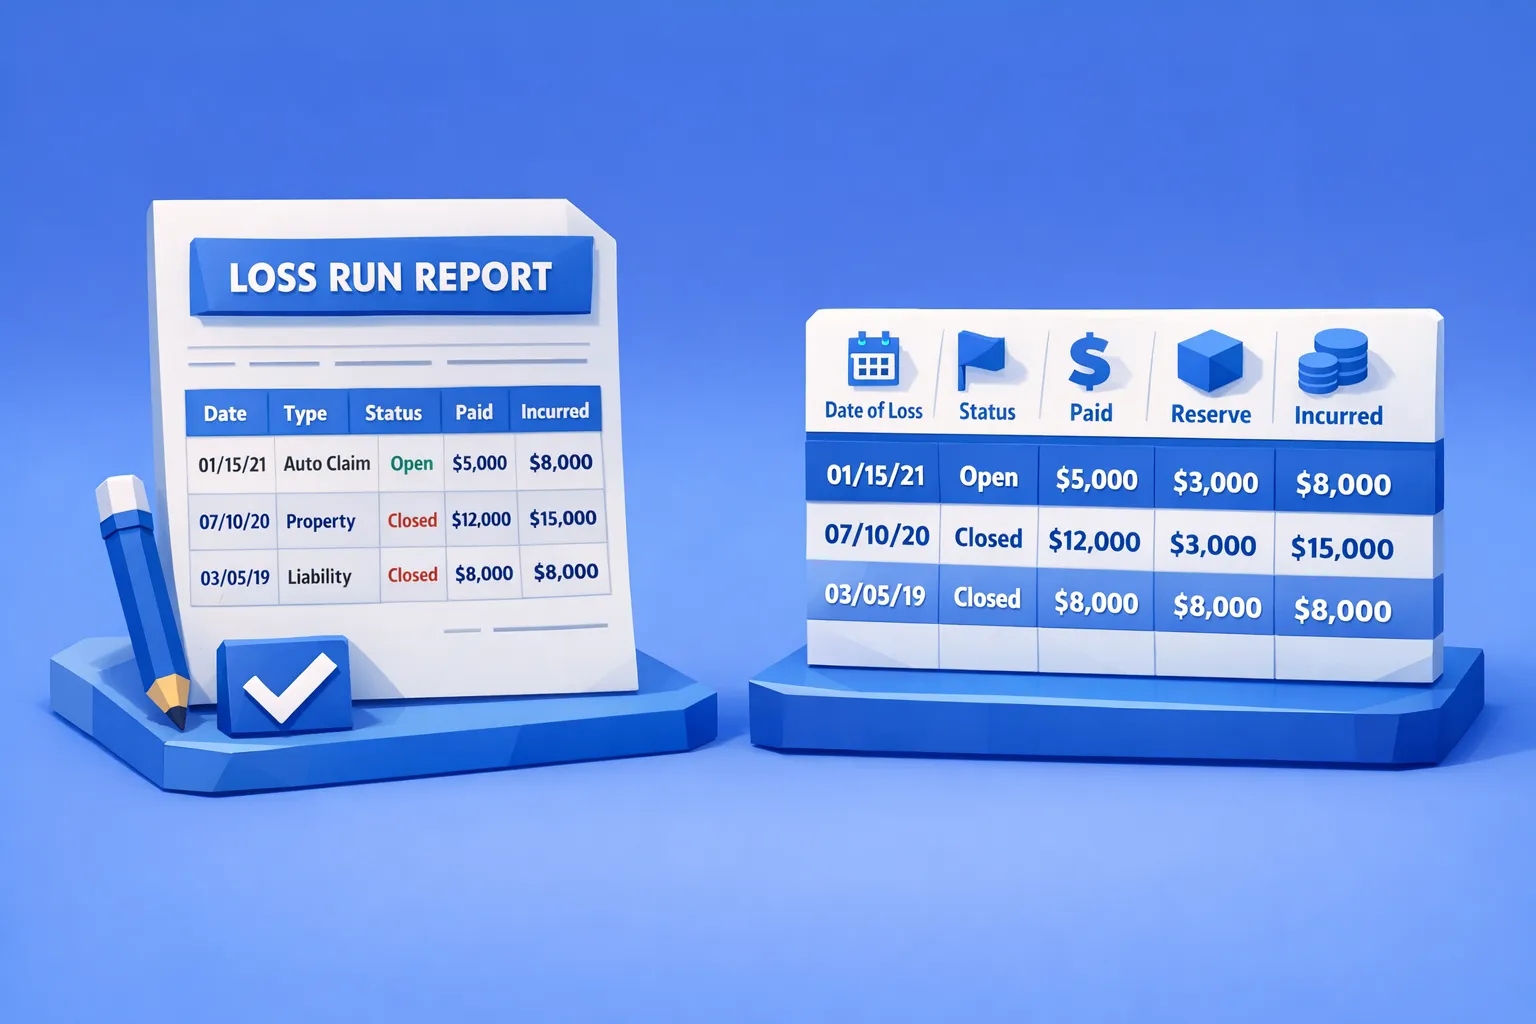
A loss run is a claim history record, typically tied to an insured (or an account) over one or more policy periods. Depending on line of business and carrier format, it may include paid amounts, case reserves, status, cause of loss, dates, and handling notes.
It is not a full claim file. A loss run rarely includes every piece of evidence an underwriter would want (police reports, statements, medical detail, litigation strategy, repair estimates). Think of it as a structured summary that enables triage.
Underwriters use it to answer three core questions:
- Is the risk behaving the way the submission says it is?
- Is the loss experience stable, deteriorating, or improving (and why)?
- How much uncertainty is hiding in open claims, immature years, or inconsistent coding?
The loss run fields underwriters care about most
Different templates label columns differently, but underwriters generally look for the same underlying signals.
Identification and exposure context
These fields help an underwriter make sure the losses actually belong to the right account, and that the time window aligns with the rating view.
- Named insured / account identifiers (and related entities)
- Policy number and policy period
- Line of business and coverage (GL, Auto, WC, Property, etc.)
- Location, unit, or vehicle identifiers (when provided)
If these fields are inconsistent, an underwriter’s confidence drops fast, because it becomes unclear whether the loss history is complete.
Claim lifecycle and timing
Dates often tell as much as dollars.
- Date of loss (when it occurred)
- Report date (when it was reported)
- Open/close dates (or current status)
From this, underwriters infer reporting behavior and process maturity. Repeated long reporting lags, frequent reopenings, or many claims that remain open “too long” can indicate operational issues, poor documentation, or disputes.
Financials: paid, reserves, and incurred
This is where underwriting decisions are made, but also where many misreads happen.
- Paid indemnity (what has been paid on the claim)
- Paid expense / ALAE (allocated loss adjustment expense)
- Case reserves (what’s still expected to be paid)
- Incurred (typically paid plus case reserves)
- Recoveries/subrogation/salvage (sometimes shown separately)
Underwriters rely on incurred because it is the best snapshot of ultimate cost with what is known today. But incurred is only as good as reserving discipline and how current the loss run is.
Classification: cause, type, severity driver
When available and consistent, classification fields enable pattern recognition.
- Cause of loss / claim type (rear-end, slip-and-fall, theft, water damage, etc.)
- Body part / injury type (common in WC)
- Litigation/attorney involvement indicators (sometimes explicit, often missing)
Good classification turns loss runs from “a list of bad outcomes” into actionable risk drivers.
What loss run insurance data tells underwriters (the actual underwriting “read”)
1) Frequency vs. severity, and which one is really driving the loss ratio
A book can be unprofitable for two very different reasons:
- High frequency: lots of small and mid-sized claims. This often points to controllable behaviors (driver management, safety programs, premises controls, claims reporting discipline).
- High severity: fewer claims, but large ones. This often points to tail risk, coverage structure, limits adequacy, aggregation, and litigation dynamics.
Underwriters look for clustering. Ten $10,000 claims does not behave like one $100,000 claim, even if the total is identical. The first may be addressable with risk control and tighter eligibility. The second may require structural changes (retentions, sublimits, exclusions, attachment points, or reinsurance strategy).
2) Development: where uncertainty is hiding in open claims and immature years
Loss runs are time-sensitive. Underwriters routinely ask:
- Are recent policy years still developing upward?
- Are there open claims with low paid but high reserves?
- Are older years “surprisingly clean,” suggesting late reporting or reserve strengthening risk?
A simple but powerful read is comparing:
- Open claim count vs. open incurred
- % of incurred sitting in open claims
High open incurred concentration means your pricing decision is more exposed to reserving practices and claim outcomes that have not settled yet.
3) Reporting lag as an operational and moral hazard signal
A consistent pattern of late-reported claims can influence underwriting appetite even if ultimate costs are not extreme.
Why? Late reporting often correlates with:
- Weaker documentation
- More disputes over facts and coverage
- Higher friction in claims handling
- Greater litigation probability in some lines
Underwriters may respond with tighter terms, different claims handling requirements, or additional underwriting questions aimed at governance and controls.
4) Litigation and expense pressure
Even when indemnity is stable, expense inflation can tilt a portfolio. Loss runs that include ALAE (or separate expense fields) allow underwriters to spot:
- Rising expense-to-indemnity ratios
- Claims that are “small indemnity, big expense” (often disputes, coverage complexity, or attorney involvement)
If litigation flags are missing (common), underwriters infer it indirectly from patterns such as long open durations, high ALAE, and repeated reopenings.
5) Concentration and aggregation risk
Underwriters look for whether losses are:
- Concentrated in one location, route, state, or insured unit
- Repeating from the same causal driver (for example, theft in a specific geography)
Even without perfect location detail, clustering by time and type can reveal aggregation. This matters for pricing, but also for limit strategy and reinsurance narratives.
6) Claim coding consistency (a proxy for data reliability)
A loss run can be “complete” and still be unreliable if:
- Cause codes are inconsistent
- Coverage labels change year to year
- Reserves appear stale
- Duplicates exist (same claim shown multiple times under different identifiers)
Underwriters treat messy loss runs as a risk factor because it increases the chance of mispricing.
How underwriters translate loss runs into decisions
Loss runs do not just inform “approve or decline.” They shape the structure of the deal.
Pricing and modifiers
Loss experience influences the technical premium, but underwriters also adjust for confidence. High uncertainty often creates a “data quality load,” even if not formally labeled that way.
Common pricing outcomes include:
- Higher rates due to deteriorating frequency or severity
- Reduced credits because improvements are not yet credible (for example, very recent risk control changes)
- More conservative assumptions when development is trending upward
Terms, retentions, and coverage structure
Loss runs frequently drive coverage actions such as:
- Higher deductibles or self-insured retentions (SIRs)
- Sublimits for repeated drivers
- Specific exclusions or tighter wording
- Risk control requirements tied to the observed claim causes
Eligibility and workflow routing
In modern underwriting operations, loss run signals are also used to route submissions:
- Straight-through for clean histories and stable patterns
- Underwriter review for edge cases
- Senior referral for large loss drivers, severe claims, or high uncertainty
This is where clean, structured loss run data becomes an operational advantage, not just a pricing input.
Common pitfalls that cause underwriters to misread loss runs
Loss run interpretation problems are often data problems.
Here are the pitfalls underwriters and operations teams see most:
- Valuation date mismatch: the loss run is not “as of” the same date across years or carriers.
- Incurred definition drift: incurred may include expenses in one run and exclude them in another.
- Gross vs. net confusion: recoveries and subrogation may be handled inconsistently.
- Duplicate claims: the same claim appears more than once due to system migrations or claim number changes.
- Open/closed ambiguity: reopened claims may look like new losses if not normalized.
- Missing exposure context: without units, payroll, sales, vehicle counts, or location detail, causal explanations become guesswork.
The practical takeaway is that underwriting quality depends on normalization and validation, not just extraction.
Turning loss runs into consistent underwriting signals (without slowing the team)
Most organizations do not struggle because they lack smart underwriters. They struggle because loss run review does not scale.
A scalable approach usually includes:
1) Standardize loss run data across formats
Loss runs arrive as PDFs, spreadsheets, emails, and portal downloads. The first step is converting them into a consistent schema (policy period, claim identifiers, dates, financial fields, classifications).
2) Validate and enrich before underwriting touches it
Validation catches issues early (missing dates, negative values, inconsistent statuses). Enrichment adds context (third-party data, hazard signals, or other external indicators) so the underwriter spends time deciding, not reconciling.
If you need help assessing where AI can realistically automate this workflow in your environment, an external partner that offers an AI opportunity audit can be useful before committing engineering cycles.
3) Store it in a unified warehouse so insights compound
A loss run is not just a one-time underwriting input. Once structured, it should feed:
- Portfolio analytics
- Claims-to-underwriting feedback loops
- Reinsurance reporting narratives
- Operational KPIs (turnaround time, referral reasons, data quality rates)
This is the difference between “we processed a loss run” and “we built an underwriting memory.”
Where Inaza fits: operationalizing loss run insights
Inaza is built for insurance workflow automation with a unified data warehouse underneath, which matters because loss run automation is only the start. Once the data is captured and normalized, it becomes available for analytics and repeatable decisioning.
For underwriting teams dealing with high volumes, Inaza can help you:
- Automate intake and extraction across file types, then push structured data into your existing systems via integration workflows.
- Deploy production-ready workflows quickly, so you spend less time in extended proof-of-concept cycles.
- Enrich workflows using pre-built API templates (including providers commonly used in insurance data ecosystems).
- Use dashboards and analytics to track what’s happening across submissions and outcomes, and compare performance using built-in industry benchmarks.
If you want a deeper look at why this matters operationally, Inaza’s post on the ROI of automated loss run extraction pairs well with this underwriting-focused guide.
Frequently Asked Questions
What is a loss run in insurance? A loss run is a record of an insured’s historical claims, typically showing claim dates, status, paid amounts, reserves, and incurred totals across one or more policy periods.
What does “incurred” mean on a loss run? Incurred is generally the sum of paid amounts plus current case reserves (and sometimes includes expenses, depending on the template). It represents the current estimated total cost of a claim.
Why do underwriters care about open claims so much? Open claims create uncertainty. Their ultimate cost can change due to reserving updates, new information, litigation, or extended treatment and repair timelines.
How many years of loss runs do underwriters typically request? Many underwriters ask for 3 to 5 years, but the right window depends on the line of business, claim tail, and the insured’s operational changes.
What are red flags in loss run insurance data? Common red flags include upward development in recent years, high open incurred concentration, repeated causes of loss, large expense-driven claims, duplicates, and inconsistent coding across periods.
Can AI automate loss run review without removing underwriter oversight? Yes. AI can extract, normalize, validate, and highlight anomalies, while routing complex cases to underwriters with clear audit trails and configurable workflows.
See what your loss runs are really saying
If your underwriters are spending too much time re-keying loss runs, reconciling inconsistent templates, or chasing missing context, the bottleneck is not expertise, it’s data operations.
Inaza helps insurers, MGAs, and brokers automate loss run ingestion and turn the results into structured, warehouse-ready data that supports faster underwriting and better portfolio insight. Explore Inaza at inaza.com and request a walkthrough to see how a workflow can be deployed and integrated into your current process.