What a Loss Run Report Reveals Before You Quote

Quoting commercial insurance without a loss run report is like pricing a risk with your eyes half closed. You can still do it, but you are forced to rely on incomplete narratives, self-reported history, and assumptions that can quietly erode profitability.
A loss run report is one of the few documents that shows what really happened in prior terms: what was claimed, what was paid, what is still open, and what loss patterns may be developing. Interpreted well, it does more than confirm “good” or “bad” risk. It tells you why the risk performs the way it does, and what to do before you quote.
What a loss run report is (and what it is not)
A loss run report is a carrier-produced history of claims activity for an insured over a defined period. In commercial lines, it is commonly requested for commercial auto, general liability, workers’ comp, property, and umbrella, especially when you need to validate experience before offering terms.
While formats vary by carrier and line of business, most loss runs include:
- Policy and term information
- Claim identifiers and loss dates
- Cause of loss (sometimes with codes)
- Paid amounts (indemnity and sometimes expense)
- Outstanding reserves
- Claim status (open/closed)
- Recovery/subrogation (in some formats)
Loss runs are best viewed as a financial and operational history, not as a complete claims narrative. They rarely tell you everything about liability posture, defenses, or detailed circumstances unless notes are appended.
For a baseline definition and context, resources like IRMI’s insurance reference materials are a helpful starting point.

The core signals a loss run report reveals before you quote
1) Frequency vs severity, and which problem you actually have
Underwriters often describe risks as “frequency-driven” or “severity-driven,” and a loss run report is the fastest way to validate which one you are dealing with.
- Frequency pattern: many small to mid claims. This can signal operational issues (training, safety culture, maintenance), process gaps, or higher-than-reported exposure.
- Severity pattern: a small count of high-cost losses. This points to tail risk, catastrophic potential, venue and litigation risk, or inadequate controls for specific scenarios.
Before you quote, identify which pattern dominates because it changes the right response. A frequency problem often pushes you toward eligibility controls, loss control requirements, deductibles, or operational improvements. A severity problem often pushes you toward limits strategy, attachment points, tighter terms, and rigorous referral.
2) Open claims and reserves (the “future loss” hiding in plain sight)
Closed claims show history. Open claims show volatility. Outstanding reserves represent the carrier’s current estimate of future payments, and they can materially change the economics of the account.
When you see open claims, focus on:
- Open count and age: older open claims can indicate complexity, litigation, or slow resolution.
- Reserve size relative to paid: a large reserve with low paid may signal early-stage severity or uncertainty.
- Reserve movement across evaluations: if you have multiple snapshots, rising reserves can indicate adverse development.
Important: reserves are estimates and can vary by carrier philosophy and timing. They are still one of the best early indicators of what may hit the book after binding.
3) Loss timing trends (improving, deteriorating, or just noisy?)
A loss run report lets you test whether losses are:
- Trending down: fewer claims, lower severity, or improving outcomes after a safety initiative.
- Trending up: increasing frequency, growing severity, or repeating loss types.
- Clustered: several losses in a narrow period, which can point to a temporary operational disruption, new territory, seasonality, or a change in exposure.
Before quoting, look for inflection points and ask what changed. New contracts, new routes, new vehicles, staffing shifts, new vendors, acquisitions, and rapid growth can all show up as loss pattern changes.
4) Cause-of-loss concentration (controllable vs structural risk)
Even when the total dollars look acceptable, cause-of-loss concentration can reveal a risk that is mismanaged or mismatched to your appetite.
Examples of what concentration can imply:
- Repeated backing incidents or rear-end collisions can indicate driver training gaps, telematics opportunity, or dispatch pressures.
- Repetitive slip-and-fall claims can indicate premises maintenance issues or documentation gaps.
- Recurrent water damage claims can indicate property maintenance issues or habitational risk factors.
The key underwriting question is not only “how much,” but also “is this pattern controllable, and will it improve under our terms and oversight?”
5) Litigation signals and attorney involvement
Many loss runs include expense fields, attorney indicators, suit status, or claim types that hint at litigation. Even when they do not, you can often infer complexity from open duration, high expense, or fast-rising reserves.
Why it matters before you quote:
- Litigation increases uncertainty and tail.
- Attorney representation can shift settlement dynamics and ultimate severity.
- Venue dynamics can make otherwise moderate losses develop unfavorably.
If you see litigation signals, it is often a trigger for tighter terms, higher retentions, or explicit referral to a senior underwriter.
6) Recoveries and subrogation (what net results might actually be)
Some loss run formats include recoveries. If they do, treat them carefully:
- A risk might look worse gross than net, or vice versa.
- Frequent subrogation potential can indicate operational exposure to third parties.
If recoveries are missing, do not assume they do not exist. It may simply be a reporting limitation.
Red flags that should change how you quote
A few loss run patterns routinely drive re-underwriting, pricing changes, or appetite decisions:
- Multiple open claims with material reserves: even if historical paid is low, your forward-looking volatility is high.
- Large-loss concentration: one or two claims dominate the total. You need to understand if those were true one-offs or structural.
- Repeat loss types with no corrective story: the same claim scenario repeats across terms with no evidence of operational change.
- Sudden deterioration in the most recent term: could indicate rapid growth, new operations, or a breakdown in controls.
- Long-tail lines showing development: older policy years still open or re-opening, indicating adverse development potential.
- Inconsistent or suspicious coding: mismatched causes, blank fields, or duplicated claims that can hide the true pattern.
None of these automatically mean “decline.” They mean “quote differently,” with conditions that reflect what the loss run is signaling.
When the loss run looks clean, but the risk may still be mispriced
A clean loss run is not always a safe risk. Before you quote, sanity-check these scenarios:
Limited history or immaturity
If the insured only has one year of loss history, low loss counts may simply reflect limited credibility. Ask what the exposure looked like over time, and whether operations scaled recently.
Exposure changes that are not visible on the loss run
Loss runs are claim history, not a full exposure profile. You can miss:
- new territories
- higher mileage, higher payroll, or new job types
- new fleets or different vehicle classes
- changes in subcontractors or third-party risk
Reporting lag and “late surprises”
Depending on the line, there may be significant lag between occurrence and reporting, and between reporting and reserve stabilization. A recent term can look artificially good.
If you are underwriting a class known for lag, you may want additional corroborating data (current valuation date, open claim notes, or claims bordereaux if available).
Common loss run report pitfalls (and how to avoid quoting on bad inputs)
Loss run reports are notoriously inconsistent across carriers and TPAs. Before you quote, verify these basics:
Confirm the “as of” date
Loss runs are snapshots. If the report is stale, reserves and statuses may be outdated. Always capture the as-of date and aim for a recent valuation when possible.
Check policy period completeness
Make sure the loss run covers the full requested years and that all relevant policy numbers are included. Missing years can make trends look better than reality.
Watch for split formats and missing fields
Some reports separate indemnity, expense, and medical. Others blend. Some omit ALAE/ULAE or show them inconsistently. If you compare accounts, normalize the components before you draw conclusions.
Identify duplicates and claim line inflation
Claims can appear multiple times if:
- claims were transferred between administrators
- coverage parts are split
- reopenings create new line entries
Before you compute metrics, deduplicate and reconcile.
A practical pre-quote workflow: turning a loss run into quote-ready insight
If you want a repeatable process, focus on a small set of outputs you can defend in audit and referral.
Data checks (fast, but non-negotiable)
- Verify insured name, policy numbers, and years included
- Confirm evaluation/as-of date
- Confirm which financial fields are present (paid, reserve, incurred)
- Flag missing causes, blank statuses, or obvious formatting issues
Underwriting metrics (keep them consistent)
Even without building a full actuarial model, you can compute consistent underwriting indicators such as:
- Claim frequency per exposure unit (vehicles, payroll, sales, locations, depending on line)
- Average severity (incurred per claim, and paid per claim)
- Incurred trend by policy year
- Open-claim ratio (open claims divided by total claims)
- Large-loss impact (share of total incurred represented by the largest claim)
The goal is not perfect precision. The goal is consistent decisioning and clear documentation of what drove terms.
Decision outputs (what changes before you quote)
Translate the loss run into actions:
- Is this straight-through eligible, or does it require human referral?
- Do you need higher deductibles/retentions, lower limits, or coverage restrictions?
- Do you need loss control requirements (training, telematics, audits, safety plans)?
- Do you need additional documentation (claim narratives, runs from another carrier, schedule changes)?
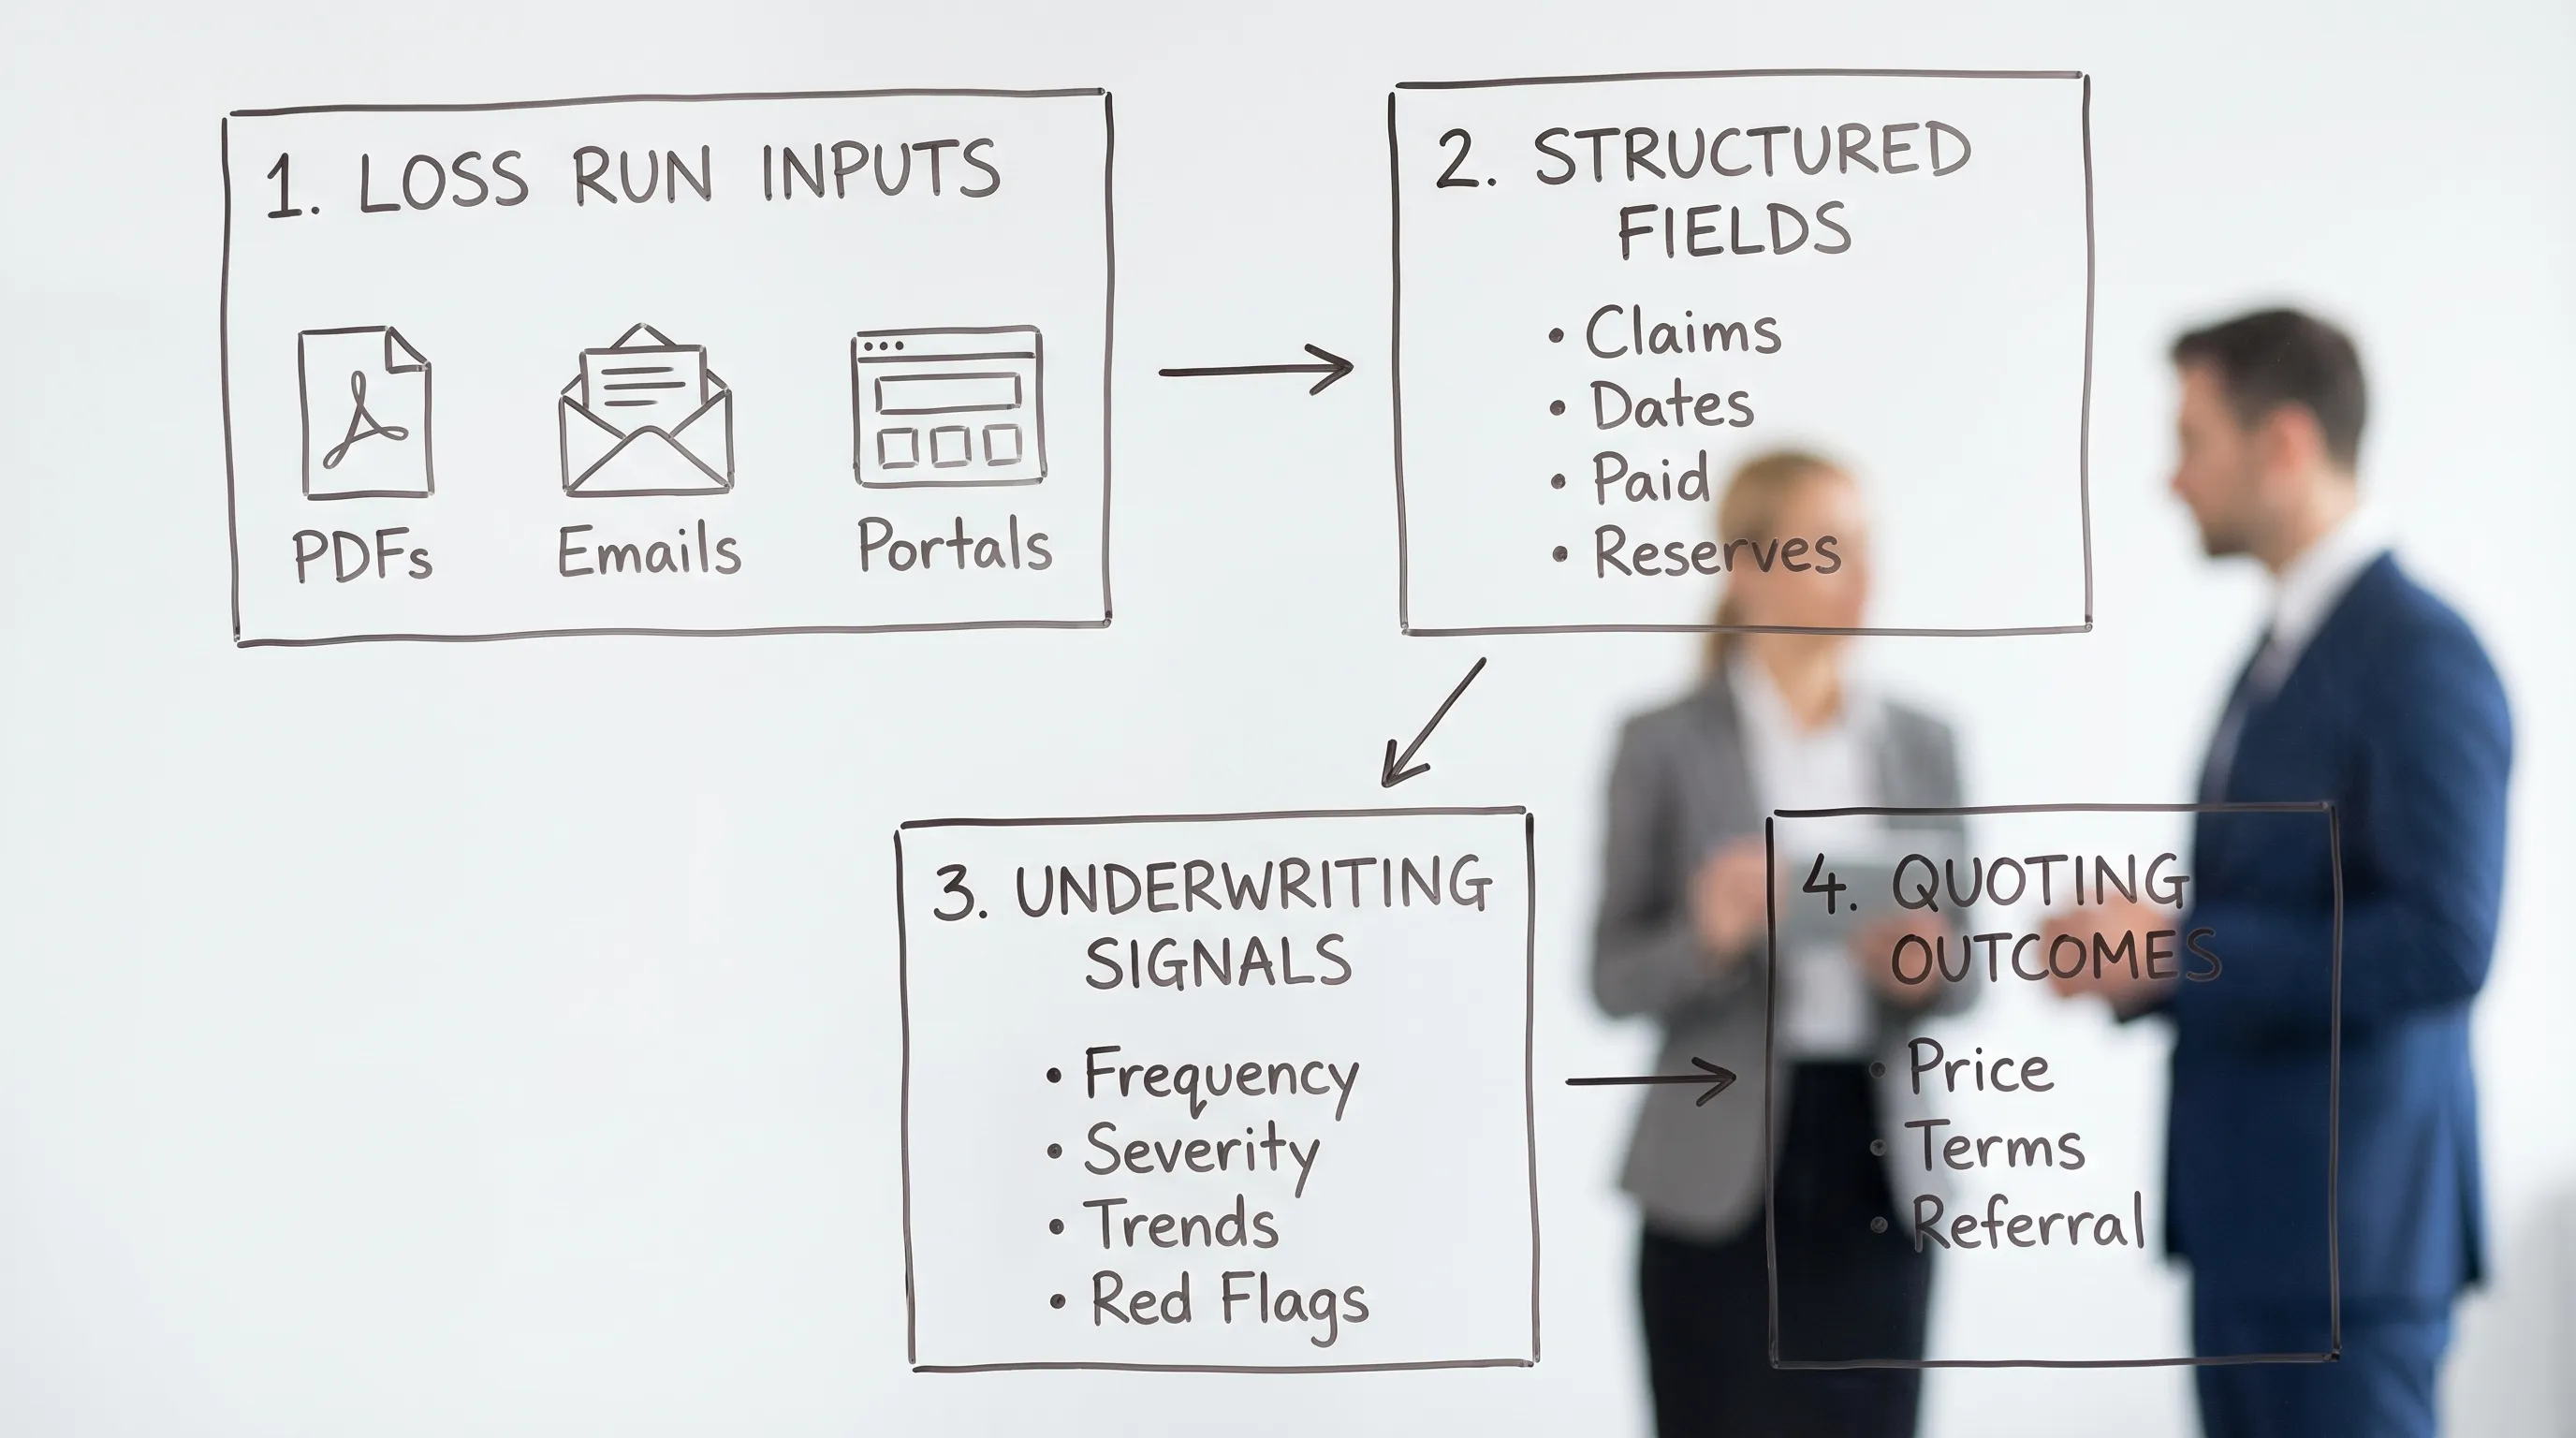
Making loss run review faster (without lowering underwriting standards)
The challenge in 2026 is not that loss runs lack value. It is that they often arrive as PDFs, emails, scans, and attachments, and the time cost to extract and normalize them can slow quoting and increase quote abandonment.
Modern teams increasingly separate the work into two layers:
- Automation for intake and structuring: extract key fields consistently across formats, then normalize.
- Underwriter oversight for decisioning: apply judgment to patterns, context, and exceptions.
Inaza’s AI data platform is built for this kind of workflow, helping insurers, MGAs, and brokers automate data capture and operational steps across underwriting and claims while integrating with existing systems. If you are dealing with unstructured loss runs, you may also find it useful to read From PDF Chaos to Structured Clarity for a deeper look at the structuring problem and what “good inputs” look like at scale.
Frequently Asked Questions
What does a loss run report reveal that an application does not? A loss run report reveals actual claims history, including paid amounts, open claims, and reserves. Applications often summarize history and can miss timing, development, and pattern details.
How many years of loss runs do underwriters typically request before quoting? Many commercial underwriters request 3 to 5 years, depending on line of business, account size, and credibility. Some classes or programs require longer.
What is the difference between paid and incurred on a loss run report? Paid is what has already been paid on the claim. Incurred is typically paid plus outstanding reserves (and sometimes expenses), representing the current estimated ultimate cost.
Why do open claims matter so much if the account has low paid losses? Open claims carry uncertainty. Reserves can develop upward, and open duration can signal litigation or complexity that changes ultimate severity.
Can a loss run report be wrong or incomplete? Yes. Loss runs can be stale (old as-of date), missing policy years, inconsistent in expense treatment, or contain duplicates. Validation before quoting is essential.
What should I do if the loss run is unreadable or arrives in multiple formats? Treat it as a workflow problem, not a one-off inconvenience. Standardize intake, extract key fields, normalize, and route exceptions for review, so quoting does not stall.
Turn loss run insight into faster, more defensible quotes
If your team is spending hours re-keying loss run data, reconciling inconsistent formats, or delaying quotes while someone “cleans up the PDF,” you are not just losing time. You are increasing operational cost and creating more opportunities for errors.
Inaza helps insurers, MGAs, and brokers automate underwriting and claims workflows with AI-driven data capture, a unified data foundation, and customizable automation that integrates into existing systems. To see how structured loss data can support faster quoting and better decisioning, explore Inaza or request a demo through the site.