Here is my hot take after a decade around insurance operations: most analytics programs do not fail because the models are weak. They fail because nobody changed a decision.
I have seen beautiful dashboards that could make a board deck look like a space launch. Loss ratios by cohort, claim frequency by zip code, conversion by channel, all glowing in neat little tiles. Then Monday morning comes, an underwriter opens the same spreadsheet, a claims supervisor routes files the same way, and finance asks why the combined ratio still looks like it has been eating doughnuts for breakfast.
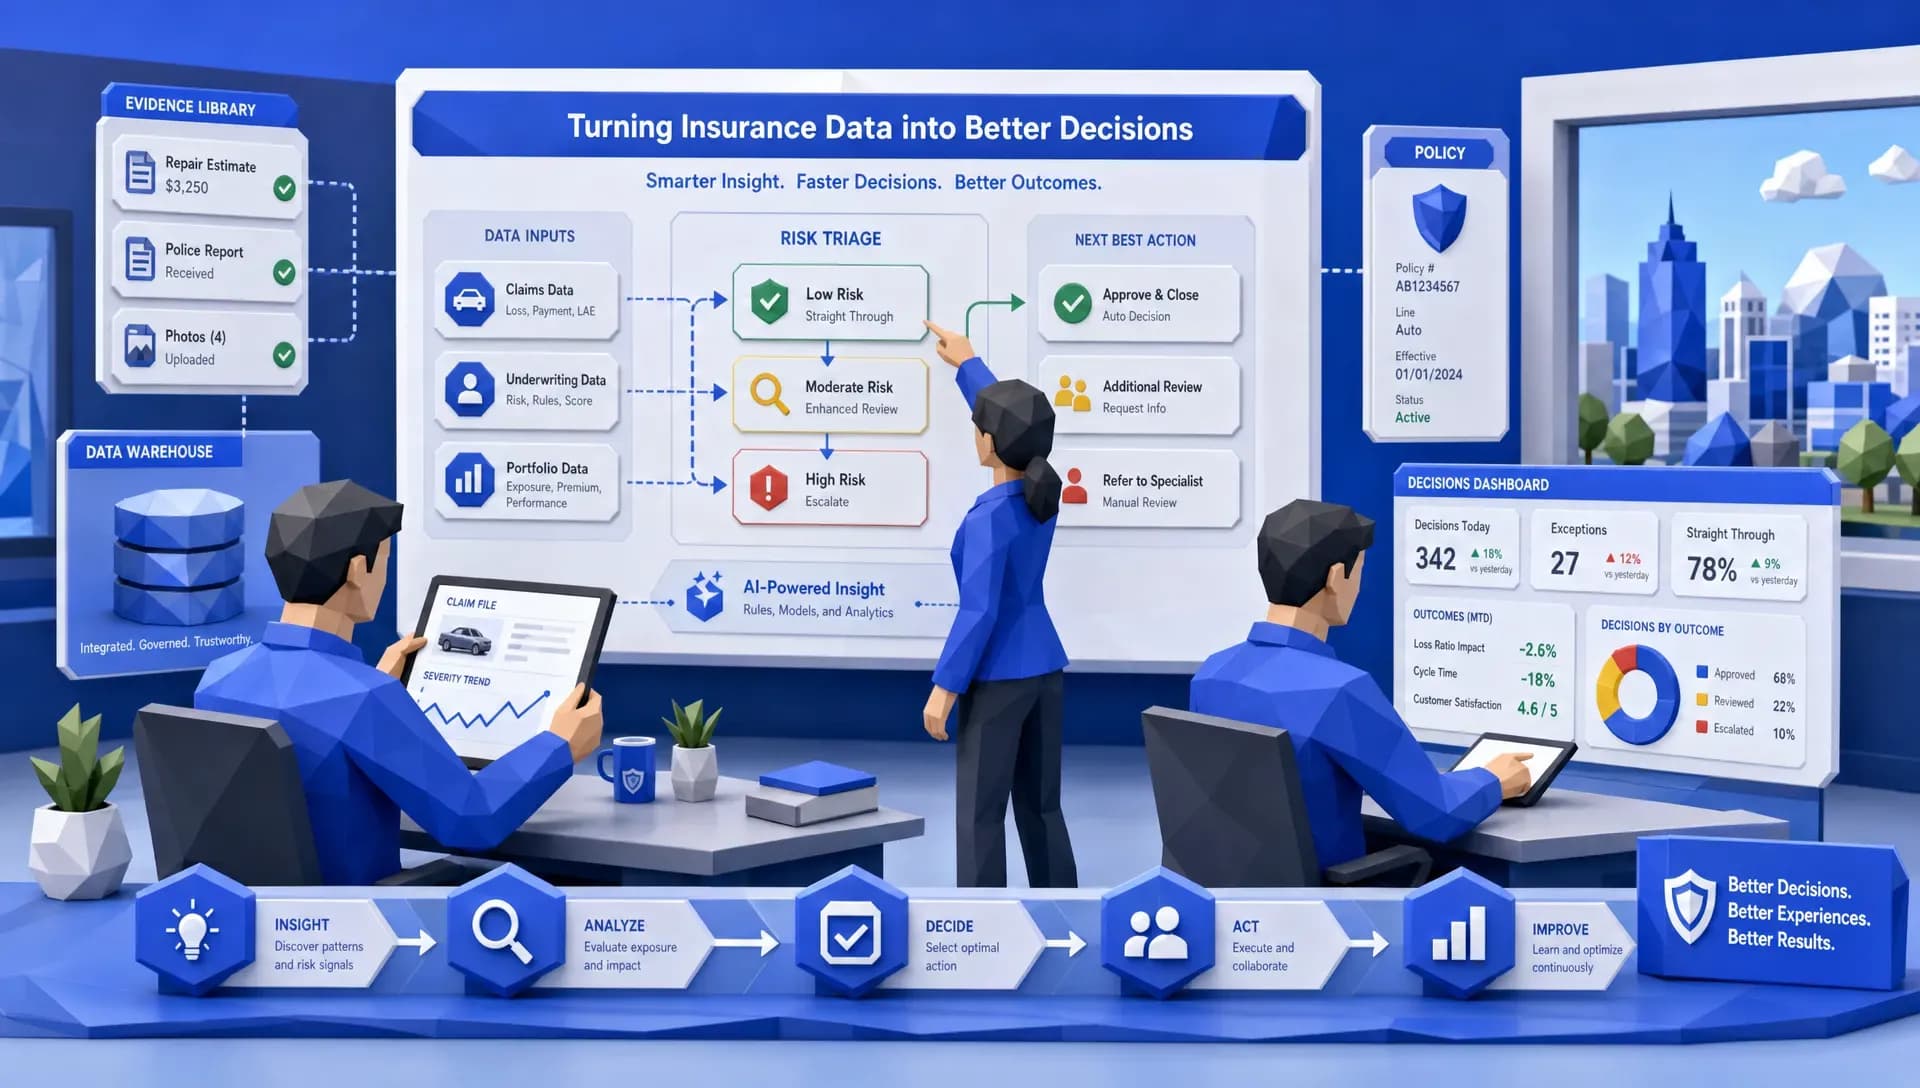
That is the gap. Data analytics for insurance companies should not be a reporting hobby. It should make a person, a team, or a workflow do something different, faster, and with more confidence.
In 2026, insurers, MGAs, brokers, and reinsurers are not short on data. They are short on decision-grade data. The difference matters.
Decision-changing analytics starts with a boring question
The best analytics question in insurance is not “What can we visualize?” It is “What decision are we trying to improve?”
That sounds almost too simple, but it changes the whole exercise. A dashboard that says claim severity is rising is interesting. A workflow that flags which open claims need senior review today is useful. A report that shows submission volume is up is pleasant. An underwriting queue that separates clean-bind opportunities from risky referrals before lunch is valuable.
The most useful insurance analytics usually attaches to one of these decisions:
- Should we quote, decline, refer, or bind this risk?
- What extra data do we need before pricing?
- Which claim should be fast-tracked, reserved higher, or sent to SIU?
- Which producer, segment, territory, or program needs attention?
- Where are we leaking margin through manual work, delays, or inconsistent judgment?
That is where analytics earns its keep. It shortens the distance between “we know something” and “we did something.”
Why insurance data so often misses the decision
Insurance data has a habit of living in places it should not. It hides in PDFs, emails, bordereaux, adjuster notes, spreadsheets, broker portals, third-party reports, policy admin systems, claims platforms, and that one shared drive nobody wants to clean up because it might contain “important history.”
I once worked with a team where the most trusted underwriting insight came from a spreadsheet called “FINAL_final_v7_USE_THIS_ONE.xlsx.” If you smiled reading that, I am sorry. You have been there too.
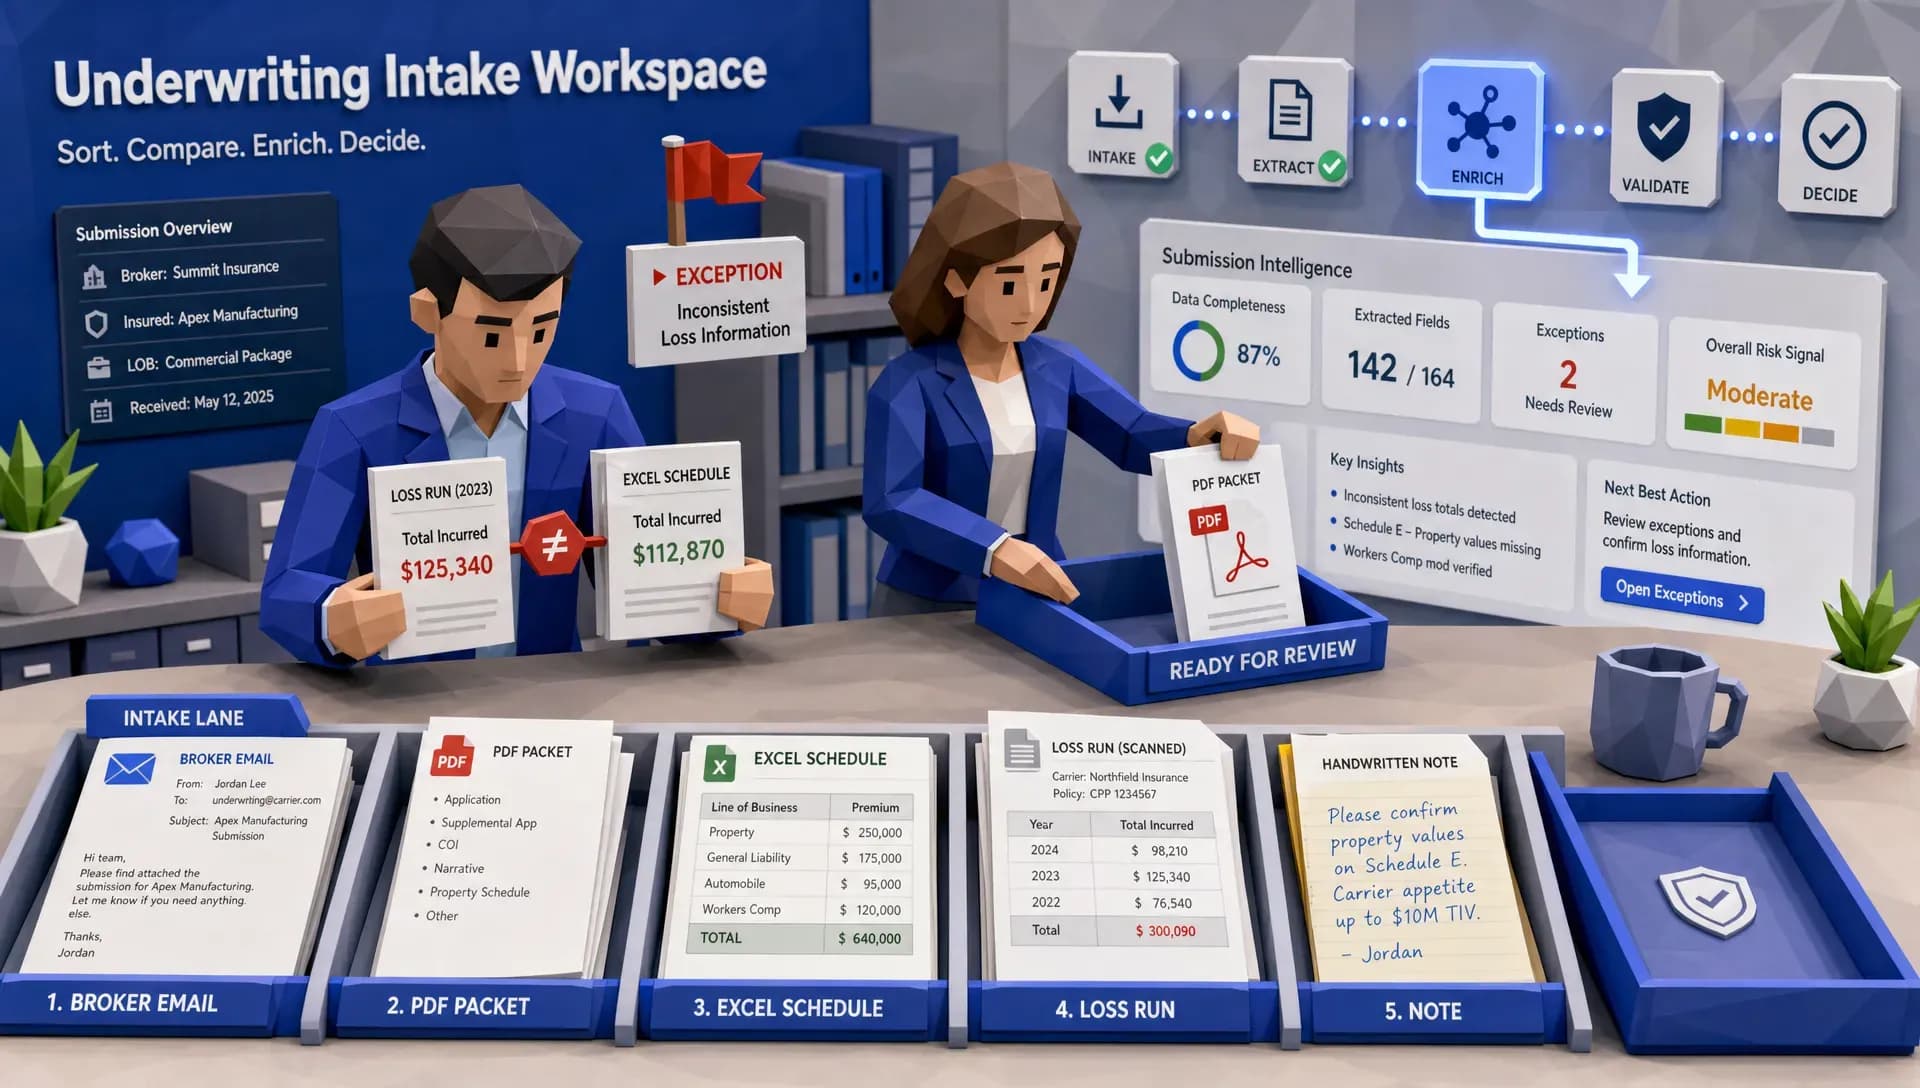
The issue is not simply messy data. The real issue is that messy data forces skilled people to become data janitors. McKinsey has reported that underwriters can spend around 60% of their time on administrative tasks rather than risk assessment. That sounds right to me. In many underwriting teams, the bottleneck is not risk appetite. It is copying, checking, rekeying, chasing, and reconciling.
If the data is not connected, analytics becomes archaeology. You are digging through the past, hoping to find a pattern. To change decisions, the data needs to arrive where the decision happens, with enough context to trust it.
That is why data integration matters so much. If your team is still debating which system has the correct exposure, limit, class code, driver count, or claim status, analytics will struggle to influence anything meaningful. Inaza has covered this problem in more detail in its article on why data integration is crucial for insurance underwriting, and I think it is one of the most underrated topics in the industry.
Ask what happens to the data after the workflow runs
When I am assessing whether a system can support decisions rather than merely record them, this is the question I keep coming back to. Is the data trapped in logs? Does it land somewhere it can be queried? Can it feed dashboards without someone exporting a spreadsheet first? Can it support a renewal narrative, a reinsurance conversation, or a management pack without a fortnight of reconciliation?
A platform that clears submissions faster is good. A platform that also tells you why submissions stall, which brokers send incomplete packs, which rating factors create referral spikes, and where leakage enters the claim process is a different proposition entirely. The first one saves time this quarter. The second one changes what the business knows about itself.
Underwriting analytics should protect judgment, not replace it
There is a lazy view that analytics is about replacing underwriters. I do not buy it. The better goal is to protect underwriters from low-value work so they can spend more time on judgment.
Good underwriting analytics helps answer questions like: Is this submission inside appetite? Is the exposure consistent with what the broker submitted? Does third-party data confirm or contradict the application? Has this account behaved differently from similar risks? Are we pricing based on reality or optimism?
Take a commercial auto MGA. A basic report might show loss ratio by state. Helpful, but limited. Decision-changing analytics goes further. It may combine driver history, vehicle mix, radius of operation, garaging location, prior losses, telematics availability, and market benchmarks. Then it tells the team which submissions can move straight through, which need more information, and which should trigger a referral.
That changes the day. The underwriter is no longer starting from a blank screen. They are reviewing a prepared risk narrative with the key issues already surfaced.
The trick is to keep the underwriting logic visible. Nobody wants a mysterious score that says “bad risk” with the confidence of a nightclub bouncer. Underwriters need to see the factors behind the recommendation, especially when the decision affects pricing, appetite, or broker relationships.
Claims analytics should move the right file at the right time
Claims is where analytics can save money quickly, but only if it respects the reality of claim handling. Adjusters do not need another chart at 4:45 p.m. They need help deciding what to touch next.
The opportunity is huge. The J.D. Power 2024 U.S. Auto Claims Satisfaction Study highlighted how claim cycle times remain a major customer satisfaction issue, with many auto claims taking more than 30 days to settle. Anyone who has worked claims knows the pain. A claim can sit quietly for two weeks, then suddenly become expensive, litigated, and emotionally charged.
Decision-changing claims analytics looks for early warning signs. A bodily injury claim with delayed treatment, a coverage question, conflicting statements, prior claimant history, attorney involvement, or unusual repair patterns should not be handled the same way as a clean windshield claim. The goal is better triage.
Attorney demand handling is a good example. A demand package from a claimant represented by a Tampa personal injury firm handling auto and negligence claims may include medical bills, narratives, liability arguments, and deadlines. A claims team needs fast extraction, comparison against policy and claim facts, reserve review, and escalation where appropriate. Analytics should help identify what changed, what is missing, and whether the claim now sits outside normal settlement patterns.
That is practical analytics. It does not admire the claim from a distance. It pushes the file toward the right next action.
Fraud analytics only works when it becomes a workflow
Fraud analytics is a classic area where insurers can get stuck between suspicion and action.
The FBI describes insurance fraud as a major cost to consumers and businesses, and the problem is getting more creative. Synthetic documents, manipulated photos, staged losses, inflated medical bills, and organized networks are no longer edge cases. They are operational realities.
But here is the rub: a fraud score alone does not catch fraud. A fraud score that nobody reviews is just an expensive decoration.
The decision-changing version is different. It routes suspicious claims to the right handler. It explains why the claim is unusual. It compares the file against known patterns. It captures the outcome so the system can improve the next alert. It also avoids crying wolf too often, because SIU teams have finite time and infinite headaches.
This is where insurers need a tight connection between analytics and workflow. If a claim is flagged but the adjuster has to open four systems, paste notes into another screen, and email SIU manually, the process will break. The insight needs to sit inside the work.
Portfolio analytics should help you tell a better story
Portfolio analytics is often treated as an executive reporting exercise. I think that undersells it.
For carriers, MGAs, brokers, and reinsurers, portfolio analytics should support decisions about capacity, appetite, renewal strategy, rate need, reinsurance narratives, and producer management. It should answer questions like: Are losses deteriorating because of frequency, severity, mix shift, inflation, claims handling, or poor risk selection? Are we outperforming the market or merely getting lucky? Which segments deserve more capital, and which ones need a polite but firm goodbye?
This is especially important in reinsurance conversations. Reinsurers do not want vague optimism. They want evidence. If you can show how your book performs against market benchmarks, how your underwriting controls have changed, and how your claims outcomes compare to peers, you have a stronger story.
That is one reason I like analytics programs that include benchmark context. Internal data tells you what happened inside your four walls. Benchmarks help you understand whether that performance is good, bad, or simply market reality wearing a different jacket.
The five signs your analytics are changing decisions
If you want a quick health check, ask whether your analytics program can pass these five tests:
- It is tied to a named decision, not a vague business objective.
- It appears inside the workflow where the decision is made.
- It shows the evidence behind the recommendation.
- It measures whether people acted differently.
- It captures outcomes so the next decision gets better.
The fourth point is where many teams stop too early. They measure report views, model scores, and dashboard adoption. Fine, but did quote turnaround improve? Did referral quality improve? Did leakage reduce? Did claims close faster? Did SIU recoveries improve? Did the book perform better after appetite changes?
If the answer is unclear, the analytics may be informative, but it is not yet operational.
Put a number on the decision you are improving
You do not need a forty-page business case, but you do need a few numbers that connect the analytics to the operation. For underwriting, that means time to clear a submission, referral rate, quote turnaround, bind rate, data entry error rate, and underwriter capacity. For claims: first contact time, cycle time, touchless handling of simple claims, litigation escalation, fraud referral quality, and customer communication. For service and operations: backlog, repeat contacts, rework, and handoff delays.
The arithmetic rarely needs to be clever. If a team receives 5,000 submissions a month and each one absorbs twelve minutes of manual intake, that is a thousand hours spent before anyone has assessed a risk. Halve it and the capacity gain is not theoretical — it is someone’s Tuesday back. The same logic applies in claims: every hour an adjuster spends gathering documents and rekeying data is an hour not spent on coverage judgement, negotiation, or the file that was quietly becoming expensive.
Data analytics for insurance companies needs a warehouse underneath it
Here is another opinion that may annoy a few dashboard vendors: the dashboard is rarely the foundation. The data layer is.
Without a reliable data warehouse, analytics can become a fresh coat of paint on a shaky wall. You still have inconsistent definitions, duplicate records, missing fields, and manual reconciliation. The dashboard may look cleaner, but the business still argues about the numbers.
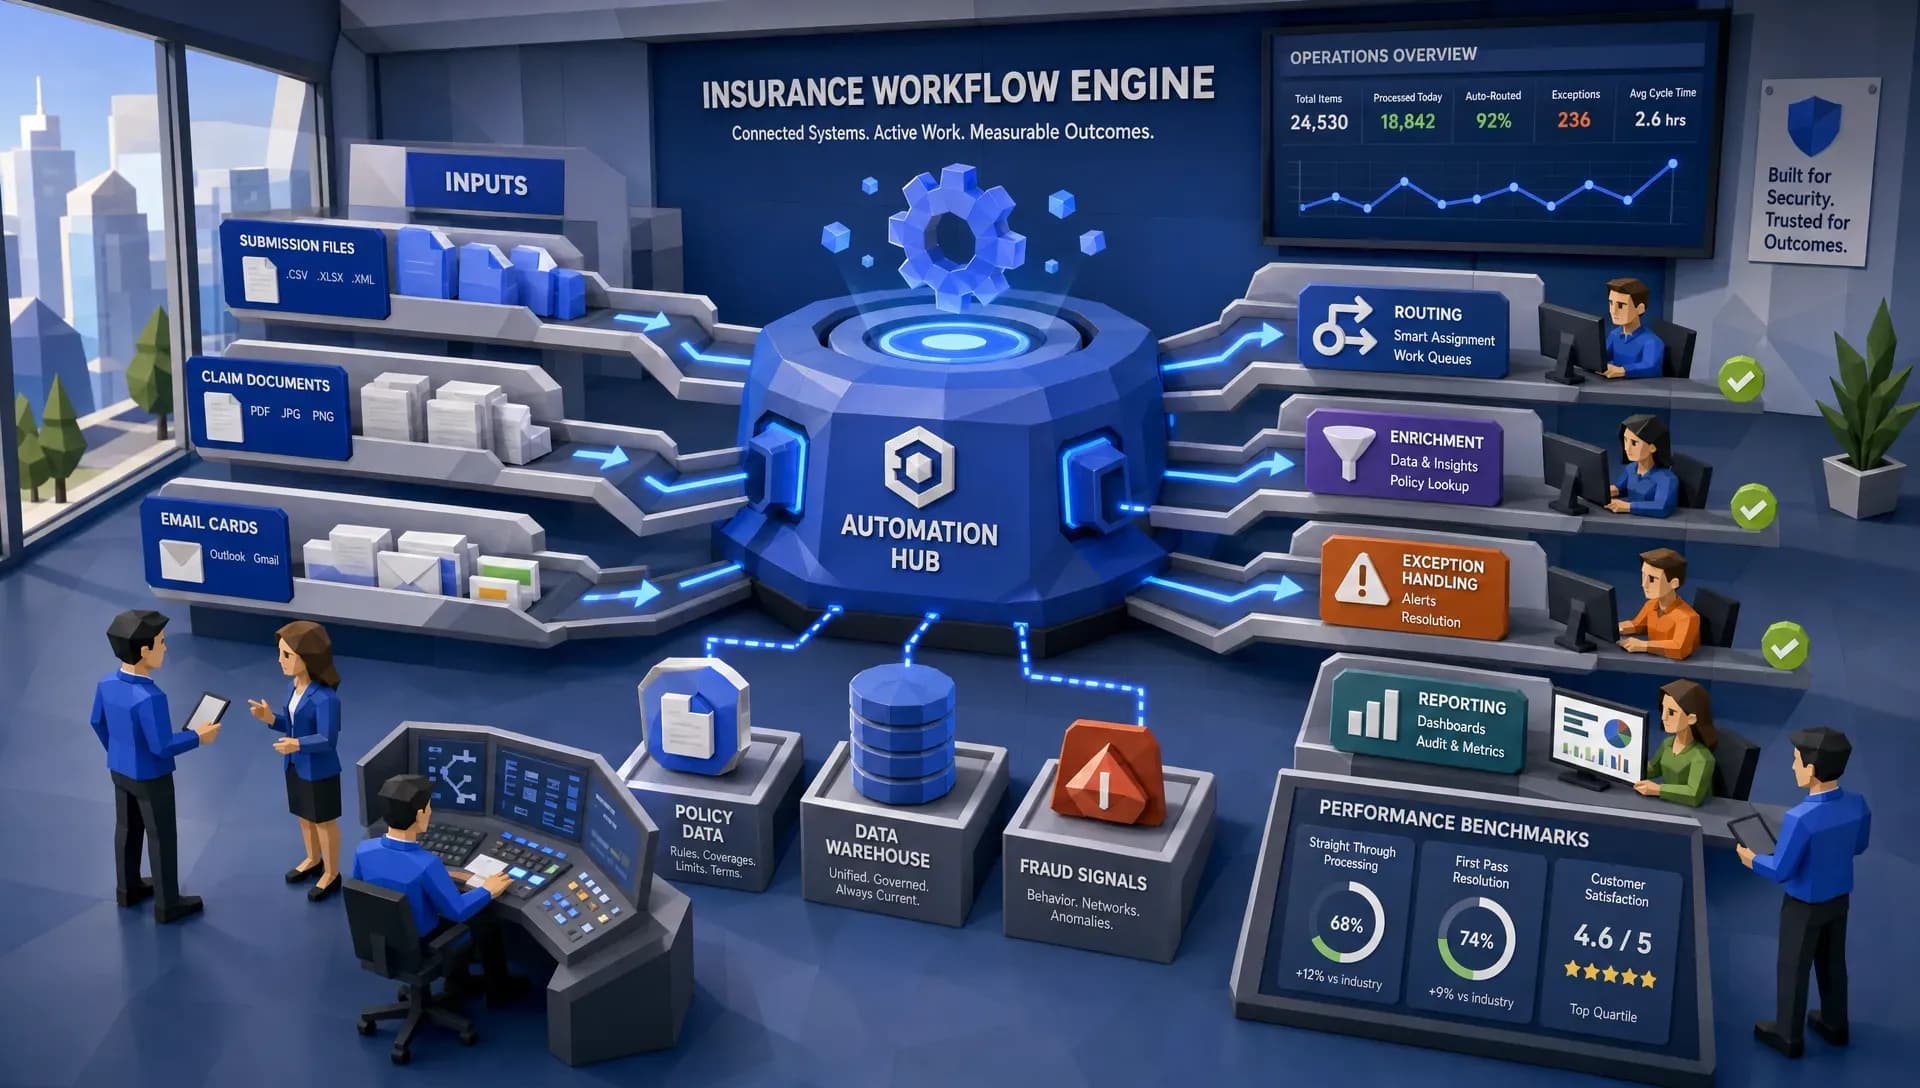
A proper insurance data warehouse brings together policy, claims, billing, submission, exposure, producer, and third-party data in a way that supports repeatable decisions. It creates one place to define the metrics that matter. It also gives leaders the ability to see how automation is affecting the business, not just whether a workflow ran.
This is where Inaza’s approach is relevant. Inaza combines insurance workflow automation with a unified data warehouse, analytics dashboards, API templates, and configurable workflows. That matters because automating a task is only step one. Capturing the data created by that task is what turns automation into business intelligence.
For example, if an underwriting workflow automatically captures submission details, enriches them through third-party data, and records the eventual decision, you now have a feedback loop. Over time, you can see which referrals were worthwhile, which data points mattered, where brokers are submitting out-of-appetite risks, and where your appetite rules need tuning.
That is much more useful than asking a team to manually update a spreadsheet every Friday, which is how morale goes to die.
Watch out for forced standardisation
One caution about the data layer, because it is where good intentions turn rigid. Standardisation is healthy when it removes variation nobody chose. It becomes a problem when it ignores how insurance actually works across products, jurisdictions, distribution channels, and delegated authority. An MGA writing a niche commercial program does not operate like a national personal auto carrier, and a reinsurance broker preparing renewal narratives does not need what a bodily injury adjuster needs. A definition layer should let those differences exist while still producing numbers that reconcile.
Build around one decision first
The fastest way to make data analytics for insurance companies useful is to start small, but start close to money.
Pick one decision that happens often, costs money when handled poorly, and has enough data to improve. For an MGA, that might be submission triage. For a carrier, it might be bodily injury claim escalation. For a broker, it might be renewal prioritization. For a reinsurer, it might be portfolio performance review.
Then map the actual decision path. Who receives the file? What do they check? Which systems do they open? Where do delays happen? What information is missing? What would make the decision easier or safer?
Only after that should you design the analytics. This keeps the project grounded. It also avoids the classic trap where a team builds a dashboard that answers a question nobody asked.
A thirty-day way to find out whether the data can carry the decision
If I were testing this tomorrow, I would not start with a requirements document. In the first week I would take one high-value decision and establish the baseline: how long it takes, how many people touch it, where the errors happen, and what the delay costs. In the second I would run real files through it, exceptions included, because the happy path teaches you nothing. In the third I would test the data story — what is captured, where it goes, and whether throughput, exceptions, broker behaviour, claim stages, and fraud flags can be reported on without a manual clean-up. In the fourth I would look at deployment reality: who owns a configuration change, which integrations already exist, and what governance is recorded automatically.
That will not answer every question, but it answers the one that matters: whether the decision you picked can actually be improved with the data you have, or whether the data layer has to come first.
If claims is your first use case, Inaza’s piece on using data insights to enhance claims management is a useful companion read. Claims analytics has to balance speed, accuracy, empathy, compliance, and leakage control. That is a lot to ask from a chart.
What “good” looks like in practice
Let’s make this concrete.
A submission arrives for a commercial auto risk. In the old process, an assistant downloads attachments, checks for missing fields, searches third-party sources, rekeys data into the rating system, and sends the file to an underwriter. The underwriter reviews it two days later, finds a discrepancy in vehicle count, and asks the broker for clarification. Everyone waits.
In a decision-changing analytics setup, the workflow extracts the data, checks completeness, enriches the submission, compares it to appetite, flags discrepancies, and routes it based on risk quality. The underwriter sees a summary of the risk, the reason for the referral, and the data behind it. Some risks move faster. Some get declined sooner. The underwriter spends more time on judgment and less time spelunking through PDFs.
The same idea applies to claims. A new injury claim arrives. The workflow captures facts of loss, coverage details, treatment indicators, prior loss data, attorney involvement, reserve changes, and comparable claim outcomes. The claim is routed based on complexity and severity signals. The adjuster knows what to investigate first. Supervisors can see which files are drifting before they become expensive surprises.
That is the difference between analytics as a rearview mirror and analytics as an operating system for better decisions.
Frequently Asked Questions
What is data analytics for insurance companies? Data analytics for insurance companies is the use of connected policy, claims, underwriting, customer, financial, and third-party data to improve business decisions. The real value comes when analytics changes actions, such as routing claims, pricing risks, identifying fraud, or managing portfolio performance.
How does analytics improve underwriting? Analytics improves underwriting by reducing manual data collection, surfacing risk signals earlier, checking submissions against appetite, and helping underwriters focus on judgment. It can also show which referral rules, broker sources, and risk segments produce profitable business.
Can analytics reduce claims leakage? Yes, if it is tied to claims workflows. Analytics can flag severity changes, coverage issues, litigation risk, suspicious patterns, reserve inadequacy, and stalled files. The key is making sure those insights trigger timely action by adjusters, supervisors, or SIU teams.
What data should insurers connect first? Start with the data needed for a specific decision. For underwriting, that may include submission, exposure, appetite, pricing, and third-party enrichment data. For claims, it may include FNOL, coverage, reserves, payments, notes, documents, litigation status, and outcome data.
How do we avoid building another dashboard nobody uses? Begin with a high-frequency decision, define what better looks like, and place the insight inside the workflow. Measure behavior change and business outcomes, not only dashboard views.
Final thought: make the decision visible
The insurance industry has no shortage of smart people. What it often lacks is a clean path from data to decision.
If analytics is separate from the work, it becomes a meeting topic. If analytics is built into the workflow, it becomes an operating advantage.
That is where platforms like Inaza can help insurers, MGAs, and brokers move faster. With configurable automation workflows, a unified data warehouse, real-time analytics dashboards, third-party API templates, and benchmark context, the goal is straightforward: turn insurance data into decisions your team can actually use.
Because at the end of the day, the best dashboard is the one that helps someone make the right call before the loss ratio starts clearing its throat.