Early in my claims career, I sat in a closed-file review where everyone expected to find a smoking gun. We had a modest auto physical damage claim that somehow became an ugly little margin eater. No staged accident. No forged invoice. No villain twirling a mustache.
The leakage came from ordinary things. A rental extension nobody owned. A storage charge that started over a weekend. A supplement that looked reasonable in isolation. A missed subrogation opportunity because the liability note lived in an email, not the claim system. By the time finance noticed, the file was closed, the money was gone, and the post-mortem had all the drama of watching paint dry.
That is the uncomfortable truth about hidden claims leakage. It usually does not look outrageous. It looks normal, one small decision at a time.
My hot take: insurance claims analytics should spend less time admiring historical dashboards and more time catching leakage while the claim is still alive. A quarterly report can tell you where the barn burned down. Useful, sure. But I would rather know which door was left open last Tuesday.
What hidden claims leakage actually means
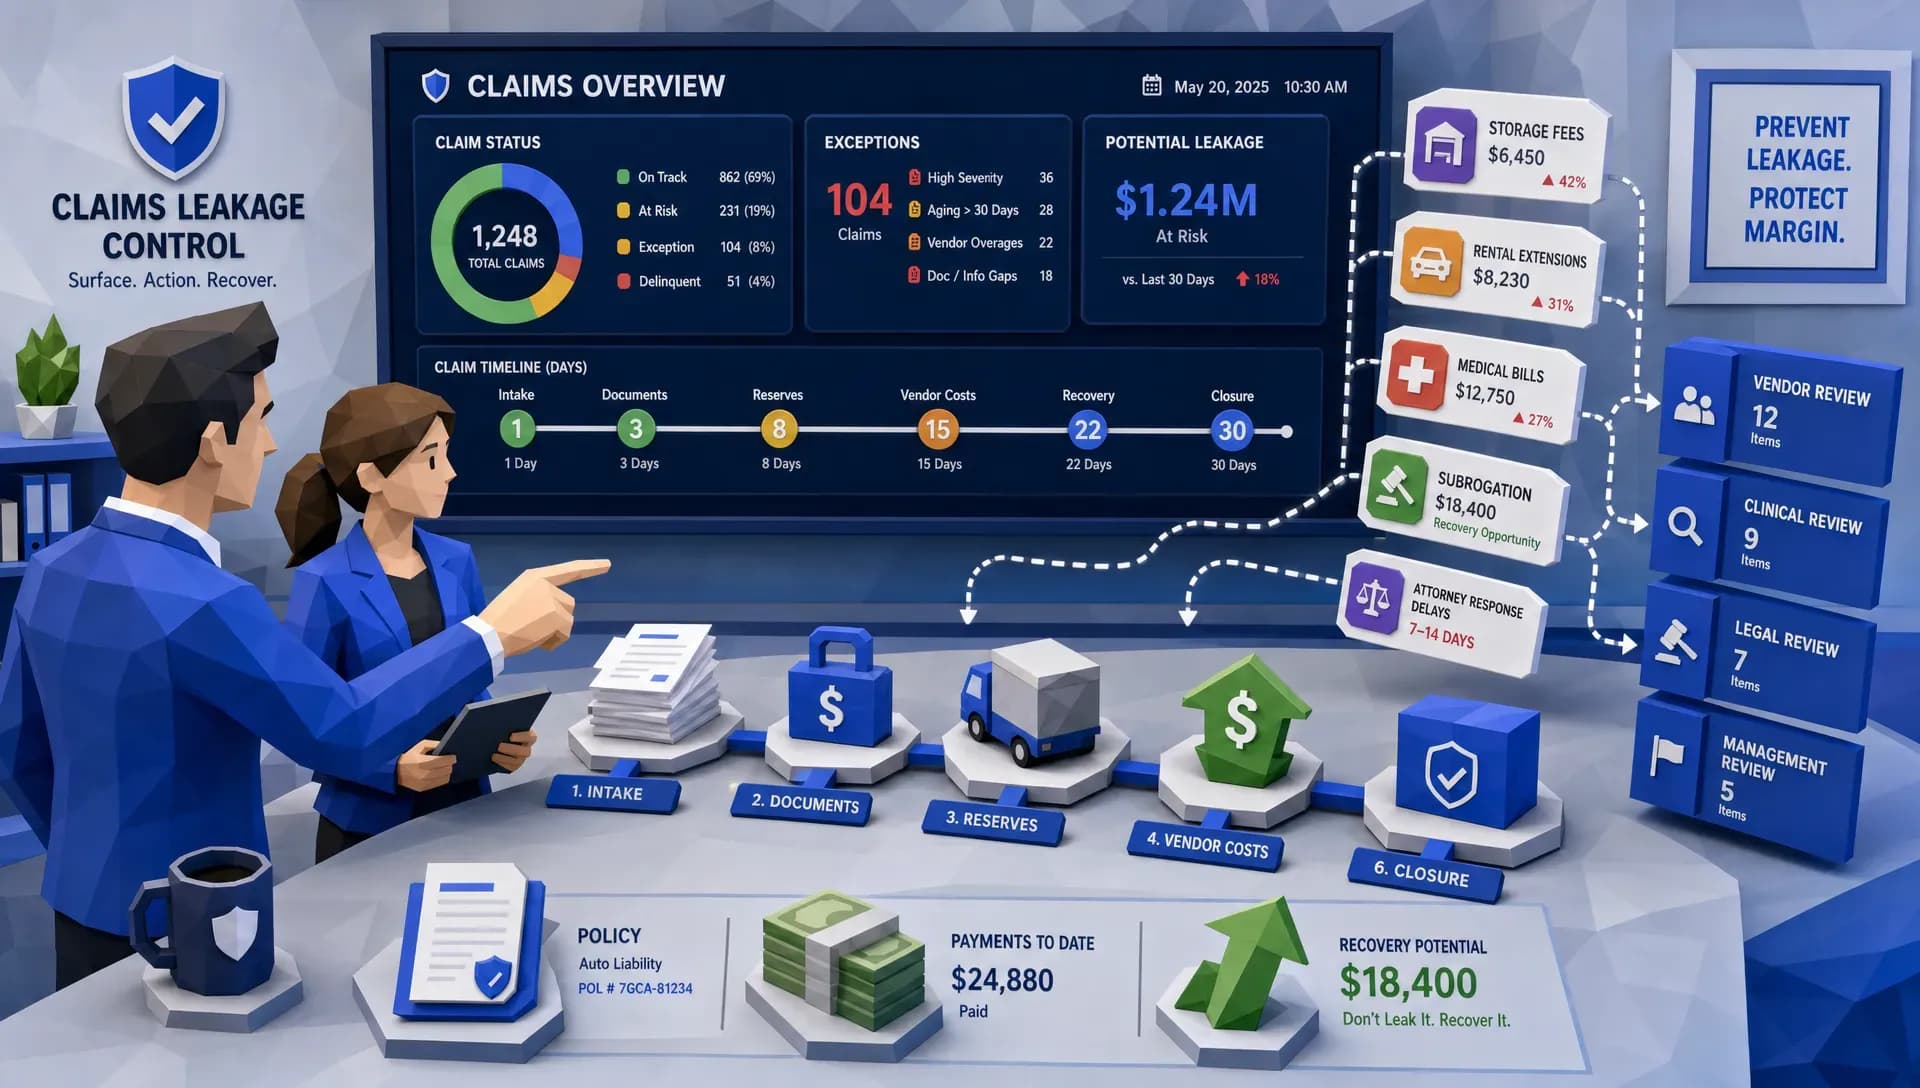
Claims leakage is claim cost that could have been avoided, reduced, recovered, or better controlled if the right information had reached the right person at the right moment. That definition matters because leakage is broader than fraud.
Fraud is the loud cousin. It gets the headlines, the SIU meetings, and occasionally the dramatic PowerPoint. It deserves attention, especially now. Verisk’s 2025 fraud report shows how worried carriers are about digital fraud, and the BBC has reported a sharp rise in fraudulent claims involving manipulated images. Nobody in claims should be casual about that.
But a lot of leakage is quieter. It is missed deductible application, duplicated payments, overlong rental, unmanaged litigation, late reserve movement, poor vendor control, missed salvage, weak subrogation, or expenses that grow because a task sat untouched for three days.
That is where insurance claims analytics earns its keep. Done properly, it does not merely show total paid loss. It reveals why cost moved, when it moved, who touched it, which data was missing, and which decision point allowed the leak to continue.
Celent has estimated that only 10% to 15% of claims are processed straight-through without human intervention. Every human touch can add judgment, empathy, and expertise. Every handoff can also create a place for leakage to hide.
Why average severity is a lousy detective
I have nothing against average severity. It is a useful metric. But if average severity is your main leakage detector, you are asking a thermometer to diagnose the flu.
Averages smooth away the weird stuff. They can make a portfolio look stable while one repair network is producing abnormal supplements, one venue is driving represented bodily injury severity, or one adjuster team is carrying late-stage reserve jumps. The total number may look fine because good claims offset bad claims. That is comforting, and also dangerous.
Insurance claims analytics should break claims into meaningful cohorts. Line of business, coverage, peril, venue, attorney involvement, vendor, vehicle type, damage type, policy tenure, FNOL channel, adjuster unit, repair cycle stage, and settlement path all matter. The leakage is often obvious once you stop blending everything into one tidy average.
A simple example: your auto collision severity is flat quarter over quarter. Great. But when you split the book, you see rental days rising only on claims assigned Friday afternoon, supplements clustering around two shops, and storage charges increasing when liability is accepted before repair authorization is complete. None of that jumps out in an executive summary. It jumps out in a claims analytics workflow that tracks the operational breadcrumbs.
Reading the loss ratio as an operations report
The same complaint applies one level up. Loss ratio — incurred losses divided by earned premium — usually gets treated as a finance artifact, discussed once a month and then filed. I think it is one of the best operations reports an insurer has, provided you stop reading it like a weather report and start reading it like a smoke alarm.
The arithmetic is simple enough to be dangerous. A book that earns $10 million and incurs $6.5 million is running at 65%, meaning 65 cents of every earned premium dollar went to losses before expenses, commissions, reinsurance and profit. That could mean pricing is roughly working. It could also mean claims are under-reserved, large losses have not developed yet, or a good segment is quietly carrying a bad one. A 90% ratio might scream bad underwriting when the real story is late triage, messy data capture, or rental days nobody needed to pay for.
My hot take, and I will happily defend it: operations move the ratio earlier than pricing does. Rate changes take time to earn through a book. A claim reported late inflates severity now. A missed fraud signal turns a manageable file into a circus now. A submission rekeyed incorrectly puts the wrong risk in the wrong tier at bind. So when someone says "we have a loss ratio problem" and reaches straight for the rate filing, it is worth asking first whether the operating model is damaging the numerator or starving the denominator.
The trend and the segmentation are where the useful signal sits. A few patterns I use:
- Frequency rises while severity stays flat: risk selection or intake rules may be drifting. Look at submission triage, appetite checks and producer mix.
- Severity rises while frequency stays flat: leakage, reserving, vendor cost or litigation may be worsening. Look at claims handling, attorney involvement, repair networks and reserve reviews.
- New business performs worse than renewals: data quality at quote or bind may be weak. Look at loss runs, third-party data, eligibility checks and the quote workflow.
- One producer or broker channel deteriorates: submission quality or appetite alignment may be uneven. Look at broker instructions, referral rules, class codes and documentation.
- Older accident years keep developing upward: reserve discipline or claim escalation may be late. Look at diaries, supervisory review and litigation management.
- Gross looks fine but net worsens: reinsurance or recoverable workflows may be off. Look at treaty coding, bordereaux quality, recoveries and aggregation checks.
None of these prove a root cause. They tell you where to ask a smarter question. The best operators I know do not ask why the ratio is bad, which is too vague to act on. They ask which workflow changed before the ratio moved.
The denominator deserves suspicion too. McKinsey’s insurance automation research points to roughly 60% of underwriter time going to administrative work rather than risk assessment, and every hour spent chasing PDFs or rekeying broker submissions is an hour not spent judging risk quality. If intake is slow, good risks leave before quote. If submissions arrive in ten formats, appetite decisions start varying by person and time of day. And a surprising share of loss ratio problems are handoff problems: underwriting sees something relevant and does not pass it to claims, claims notices a recurring issue that never reaches appetite rules, a broker clarifies something by email and the note never becomes structured data. Everyone is busy. Everyone is trying. The ratio does not care.
Which is why I would rather have an explainable loss ratio than a good one. A good ratio nobody can explain may be under-reserved, riding favourable weather, or hiding one producer behind three strong ones. An explainable ratio tells you why it moved, and that is the version that survives a board meeting, a renewal negotiation and a reinsurance conversation.
The five leakage zones claims analytics should monitor
1. Reserve movement that arrives too late
Late reserve movement is one of the best signs that a claim changed character before the system noticed. Sometimes that is unavoidable. Injuries develop, liability facts change, new parties appear. Claims are living things.
But repeated late reserve jumps by claim type, venue, adjuster group, or attorney pattern should raise eyebrows. Insurance claims analytics can compare initial reserve, first update, medical indicators, attorney involvement, repair estimate changes, and settlement timing. The question is not whether a reserve changed. The question is whether similar claims gave earlier signals that were missed.
When analytics flags late movement patterns, managers can improve triage rules, refine escalation triggers, and coach teams before the next batch of files drifts.
2. Vendor spend that looks acceptable file by file
Vendor leakage is sneaky because each invoice can look defensible. A tow charge here. A storage day there. A repair supplement that seems plausible. A medical bill review fee. A field appraisal fee.
The file handler may approve it because, in context, it does not look insane. The problem appears only when you compare vendor behavior across comparable claims. Does one repair shop submit supplements at twice the rate of peers? Does one towing provider consistently bill more storage days after weekends? Does one medical provider correlate with longer claim duration and higher attorney involvement?
That is not an accusation. It is a question worth asking with data. Good analytics lets claims leaders have better vendor conversations without relying on gut feel or hallway folklore.
3. Rental, storage, and cycle-time drift
Rental and storage leakage is the claims equivalent of leaving the faucet dripping. Nobody panics at first. Then the bill arrives.
Cycle time is also a customer issue. J.D. Power’s 2024 U.S. Auto Claims Satisfaction Study continues to highlight how delays and process friction weigh on claim satisfaction. Customers compare claims to every other financial experience they have. The mortgage world, for instance, has moved toward secure uploads, e-signatures, clearer guidance, and faster approvals through providers like New Era Lending’s technology-driven mortgage process. Claims teams do not need to copy mortgage workflows, but policyholders absolutely expect the same level of clarity when documents, decisions, and money are involved.
Insurance claims analytics should show where claim age turns into cost. Not just open-to-close duration, but the smaller clocks inside the claim: FNOL to assignment, assignment to contact, contact to inspection, inspection to estimate, estimate to authorization, authorization to payment, and payment to closure.
When one clock runs long, leakage often follows.
4. Missed recovery opportunities
Subrogation and salvage leakage rarely announces itself. It simply disappears. A file closes with money left on the table because comparative negligence was not pursued, a liable third party was not identified, salvage value was not captured, or recovery referral happened too late.
This is where connected claims and underwriting data can help. If FNOL notes, police reports, photos, repair data, coverage information, and claimant statements sit in separate places, recovery signals are easy to miss. Analytics should detect indicators like rear-end loss descriptions, multi-party accidents, adverse carrier details, tow yard data, total loss markers, and liability language buried in notes.
For MGAs and carriers, this can become a real margin lever. For reinsurers and reinsurance brokers, recovery discipline also helps tell a better portfolio story. A book with visible recovery controls is easier to explain than a book where leakage is shrugged off as normal noise.
5. Litigation and attorney demand escalation
Attorney involvement is not automatically leakage. Plenty of represented claims are legitimate and should be handled professionally. The leakage appears when the file posture is late, inconsistent, or unsupported by complete data.
Analytics can compare attorney representation timing, demand amounts, injury categories, treatment duration, venue, prior claim patterns, reserve adequacy, and settlement outcomes. The goal is not to turn every represented claim into a red flag. The goal is to identify the files where early action can prevent avoidable expense.
The best claims teams I have worked with do not wait for attorney demands to become fire drills. They watch for leading indicators, prepare documentation early, and keep escalation rules crisp.
Why most claims dashboards miss the leak
A dashboard can be beautiful and still be useless. I have seen dashboards with color palettes worthy of an art museum and operational value somewhere between a paperweight and a decorative candle.
The problem is usually not the chart. The problem is the data underneath it.
Many claims dashboards rely on closed-file data, payment codes, reserve snapshots, and broad categories. That gives leadership a rearview mirror. It does not show the live workflow conditions that created leakage in the first place.
To reveal hidden leakage, analytics needs three ingredients.
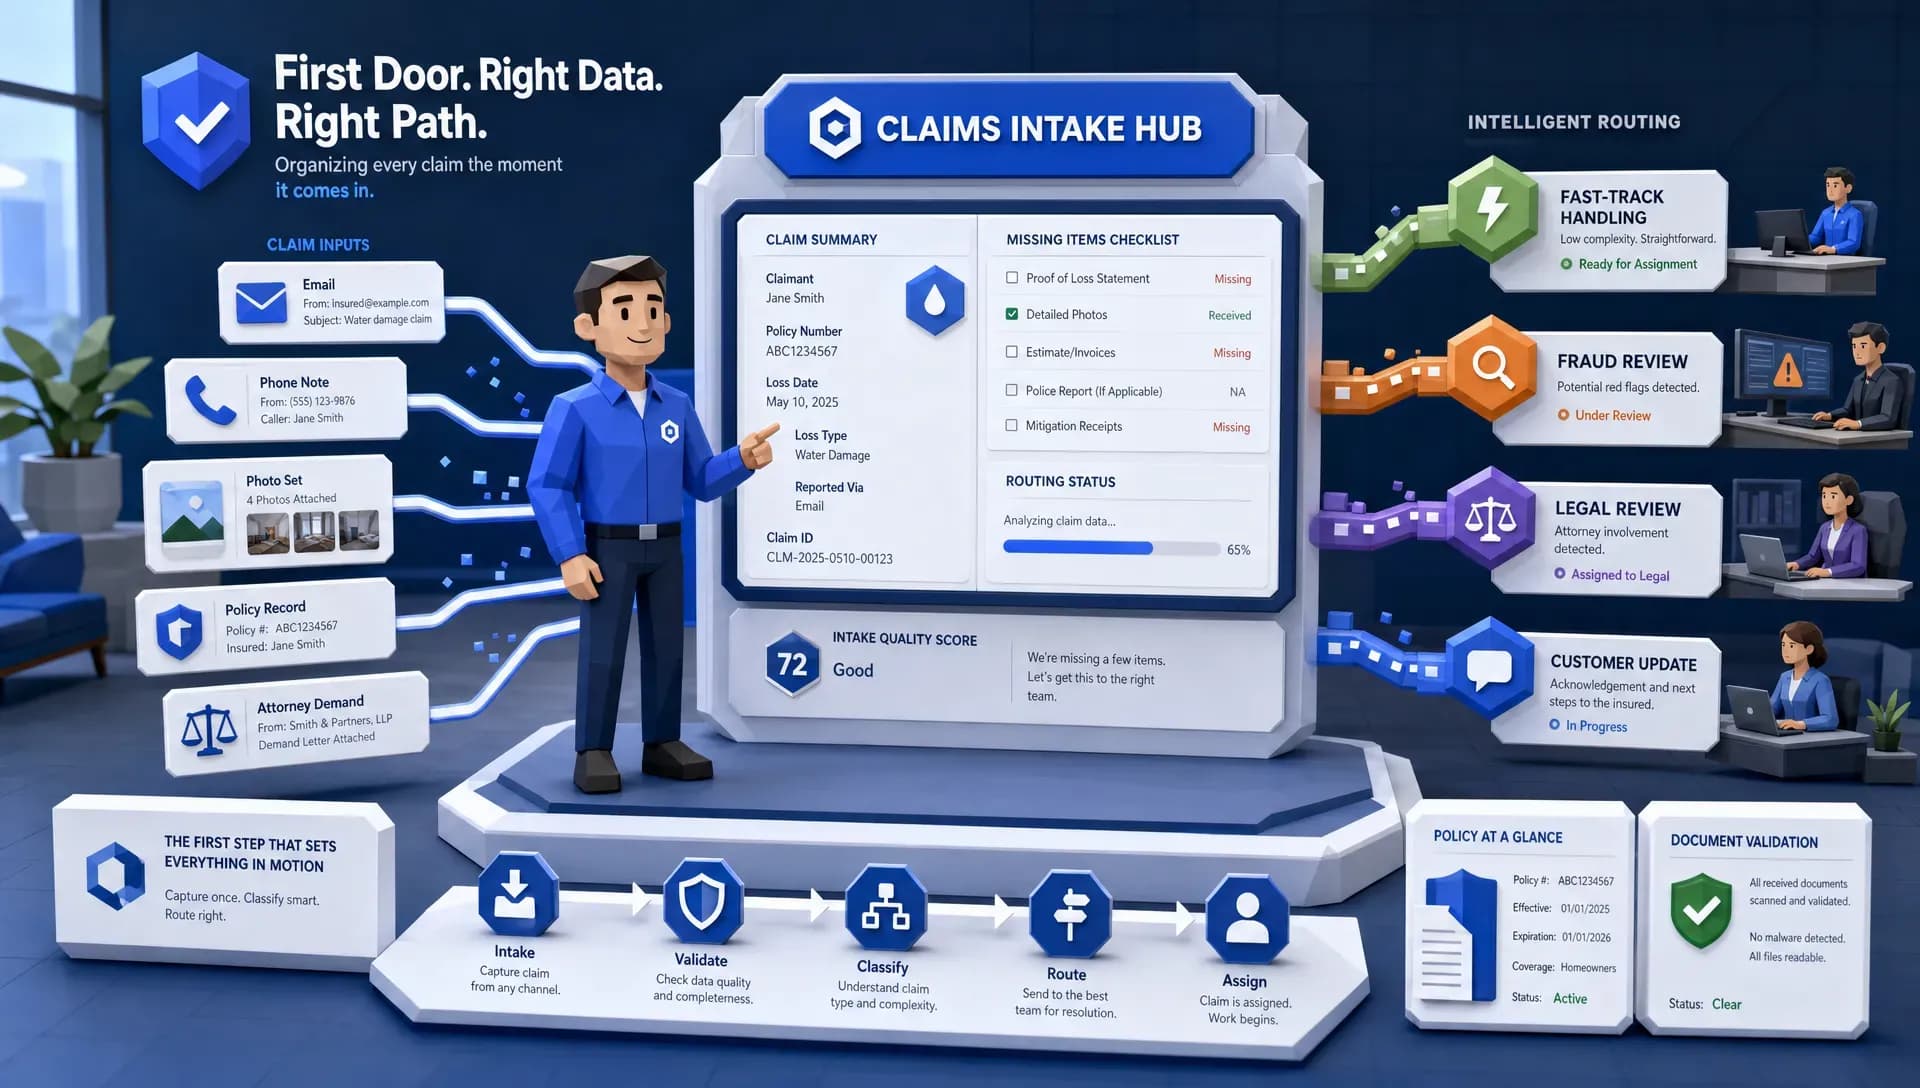
First, it needs structured claim data from core systems, documents, images, emails, notes, vendor invoices, FNOL records, and payment activity. Claims leakage loves unstructured files. PDFs, photos, demand letters, and inbox threads are prime hiding places.
Second, it needs workflow context. Who touched the file? What task was pending? Which SLA was missed? Was the claim waiting on a vendor, a claimant, an adjuster, or a system handoff? Without workflow data, you can see the outcome but not the cause.
Third, it needs comparison. A claim only looks unusual when compared to the right peer group. A rental duration that is fine for a severe repair may be excessive for a minor bumper loss. A supplement that is normal in one vehicle class may be strange in another.
This is why I am a big believer in connecting automation with analytics. If your workflow system captures the right data as work happens, your analytics becomes sharper every day. If analytics is bolted on after the fact, you get prettier reports but fewer interventions.
For a deeper look at this data capture mindset, our article on operations observability in insurance is a useful companion.
What good insurance claims analytics looks like in practice
Good insurance claims analytics feels less like a report and more like a leakage radar.
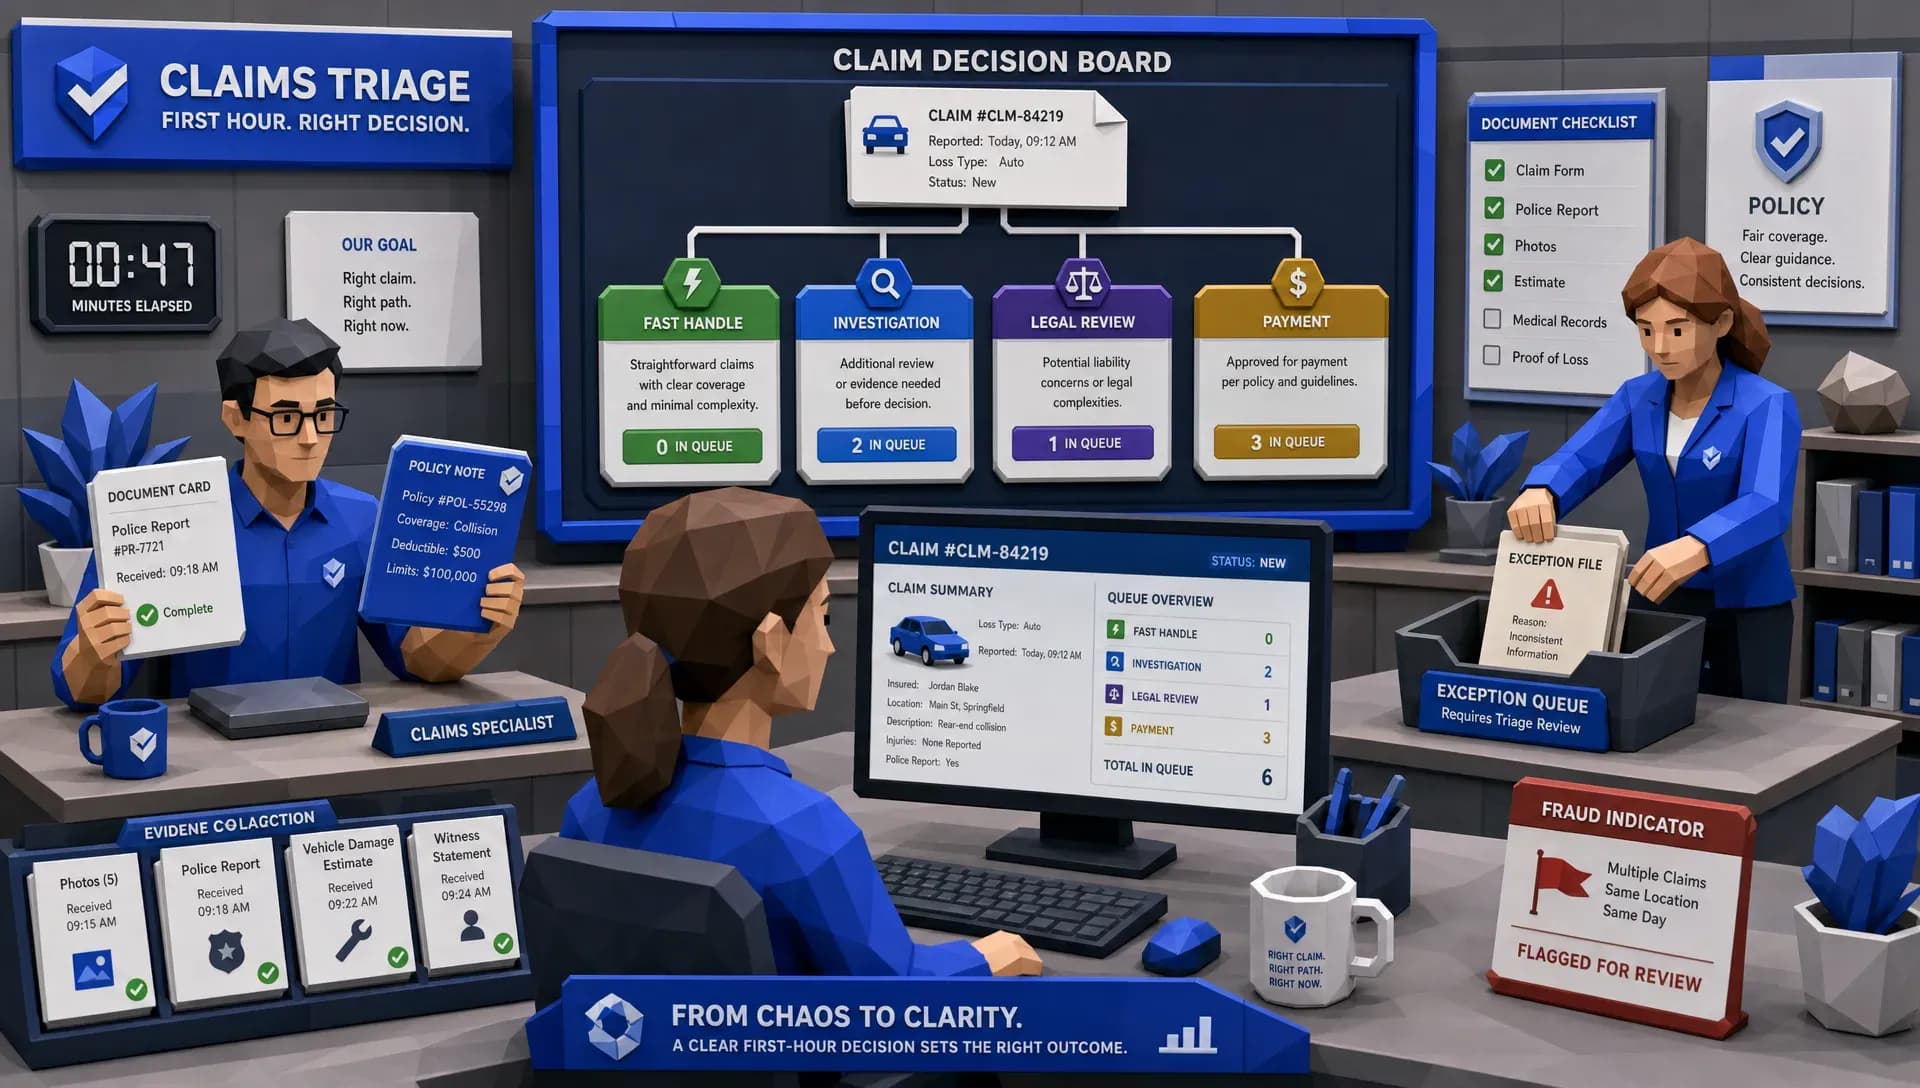
For an adjuster, it might surface a file where rental days are trending beyond peer expectations because repair authorization is delayed. The adjuster does not need a lecture. They need the next best action and the evidence behind the alert.
For a claims manager, it might show that one team has higher reopen rates after low-severity closures. That could mean training, workload, unclear authority, or a process gap. The point is to investigate, not to blame.
For a fraud analyst, it might connect image metadata issues, duplicate photo patterns, invoice anomalies, and claimant history into a prioritized review queue. The analyst spends less time chasing weak alerts and more time on files that deserve attention.
For an underwriter, it might show that a segment priced as low-risk produces frequent small claims with high expense leakage. That should feed renewal pricing, eligibility rules, and appetite decisions.
For a CFO, it should separate paid leakage, estimated avoided leakage, recoveries, reserve movement, and operational cost impact. Please, for everyone’s sanity, do not put all of that into one heroic savings number. Conservative measurement builds credibility.
Renewal is where claims data earns its second paycheck
Most renewal files arrive with plenty of claims data and surprisingly little claims insight. The spreadsheet says there were four losses. Fine. It rarely says whether the insured reported the water damage quickly or waited until the ceiling looked like oatmeal, whether reserves moved because the damage was worse than expected or because documentation was poor, or whether one building drove the experience while the other nine behaved themselves.
This is the same data read for a second purpose. Leakage analysis asks what this book cost us and why. Renewal analysis asks what this account is likely to cost us next year and what we can change about that. Both die in the same place — a claims history that never reaches the underwriter in a usable form.
The signals worth pulling before you price
- Peril frequency and preventability. One wind claim in a storm-heavy county is weather. Three interior water losses across two policy terms is maintenance, tenant behaviour, vacant-space monitoring or slow reporting.
- Reporting behaviour. Date of loss against date reported is a simple, brutally informative signal. Fast reporting usually means the insured wants to control damage. Late reporting means water spreads, mould develops, and contractors start work before an adjuster inspects.
- Reserve movement. A claim that opens at $25,000 and closes at $28,000 is a different animal from one that opens at $25,000, sits quietly, and jumps to $140,000 six months later. Ask what caused it, whether it was avoidable, and whether it can repeat.
- Repair and mitigation behaviour. Mitigation speed, approved vendors, repair completion, code upgrade issues, follow-up inspection. If the insured fixed the roof or replaced the failing pipework, that should count in their favour.
- Documentation and handling flags. Missing cause-of-loss detail, absent repair evidence, or a pattern that suggests weak controls. Separate weak evidence from deliberate deception, then make sure the renewal file records which one you concluded.
Clean the data before it starts giving speeches
Bad data is like office gossip. It sounds confident, spreads quickly, and leaves out the context that mattered. Before any of this is useful, every claim needs to be tied to the correct policy term, insured entity, location, coverage part, cause of loss, status, paid amount, case reserve, date of loss, date reported and closure date. If one system calls it water escape, another water damage and a third plumbing, your trend line is already wearing a clown nose.
Then normalise against exposure. A $75,000 loss means one thing on a small retail building and something else entirely on a large industrial schedule, so total insured value, square footage, occupancy, construction type, protection class, roof age and catastrophe exposure all belong in the comparison. This is the same peer-group discipline that makes leakage visible, applied to a different question.
And then turn the signal into an action, because pricing is the obvious lever and the least precise one. Deductibles, terms, inspection requirements, maintenance evidence, location-level action and reporting expectations all move independently, and on a multi-location account the right answer is often a targeted change rather than a portfolio-wide rate move. Sometimes the claims data gives you the confidence to defend an account instead of surcharging it — one large weather loss, handled well, repairs completed, no frequency issue. Run the workflow early enough to use it: pull the history 90 to 120 days out, enrich it with exposure context by 60, and have the renewal narrative, broker questions and proposed terms ready by 30. One warning while you are at it — do not treat missing data as neutral. If repair documentation or cause-of-loss detail is absent, that uncertainty has a value, and it should shape your questions and your confidence rather than being rounded to zero.
How Inaza approaches leakage analytics
At Inaza, we see leakage analytics as a workflow problem as much as a reporting problem. If the data is captured too late, the claim is already halfway down the river.
Inaza’s AI-powered insurance automation platform helps insurers, MGAs, and brokers automate data capture across underwriting, claims, customer service, and operations. The platform integrates with existing systems, supports all file types, and uses a unified data warehouse so workflow data can become business intelligence instead of disappearing into operational fog.
That matters for claims leakage because the useful signal may live in a demand letter, repair invoice, FNOL note, image file, email thread, or third-party data source. Inaza’s pre-built workflow templates and API templates, including data enrichment options such as Verisk, LexisNexis, HazardHub, and more, help teams connect those signals without forcing a full system replacement.
The data warehouse underneath the workflow is the piece I wish more claims leaders would ask about during vendor evaluations. Automation speeds up work. Data capture explains the work. Dashboards and benchmarks then help leaders see whether claim outcomes are improving against internal history and market reference points.
And yes, speed matters. Inaza is designed so insurers can deploy production-ready workflows quickly, including highly focused workflows that do not require months of proof-of-concept theater. I say that with love for procurement committees everywhere, but also with battle scars.
A practical 30-day leakage sprint
You do not need to boil the ocean. In fact, please do not. The ocean has enough problems.
Start with one leakage thesis. Pick a claim type where leaders already suspect margin is leaking: auto physical damage supplements, represented BI escalation, rental overrun, invoice review, subrogation referral, or reopened claims.
Then run a tight sprint.
- Define the leakage question: Choose one question that can be answered with data, such as which repair vendors produce abnormal supplement frequency after controlling for damage type.
- Build a clean cohort: Pull comparable claims from the last six to twelve months and segment them by coverage, severity, geography, vendor, adjuster unit, and closure path.
- Capture live workflow signals: Track open claims for the same indicators, including task age, missing documents, reserve changes, invoice timing, and escalation events.
- Create action rules: Decide what happens when a file is flagged, who reviews it, what evidence is shown, and how false positives are recorded.
- Measure conservatively: Separate confirmed recoveries, stopped payments, avoided expense estimates, cycle-time improvements, and operational savings.
The most important step is number four. A leakage alert with no action path is just a noisy doorbell. Someone hears it, everyone gets annoyed, and nothing improves.
Do not turn analytics into a blame machine
Claims adjusters already carry enough weight. If analytics becomes a scoreboard for public shaming, the best people will find ways around it. I have seen that movie. The ending is poor data quality and very quiet meetings.
Use analytics to improve the system. If a file sat untouched, ask whether workload, routing, authority levels, vendor response, or missing data caused the delay. If one adjuster has higher leakage indicators, look at assignment mix before assuming performance. If a fraud model flags too many legitimate claims, tune the process and protect the customer experience.
Every flag should be explainable. Every workflow should keep an audit trail. Every team should know which decisions remain human decisions. This is especially important in regulated claims environments, where consistency and documentation matter as much as speed.
The best claims analytics programs make good adjusters better. They do not replace judgment. They give judgment better facts.
The real prize: leakage prevention, not leakage discovery
Finding leakage after payment is useful. Preventing it before payment is better.
That shift requires claims analytics to move closer to the work. The analytics should run when FNOL arrives, when a repair estimate changes, when an invoice is submitted, when a reserve moves, when an attorney letter appears, and when a recovery signal is detected.
This is also where claims and underwriting become better partners. Leakage patterns should feed pricing, appetite, renewal underwriting, broker conversations, and reinsurance narratives. If a portfolio has recurring claims leakage in one segment, underwriting should know. If underwriting changes reduce downstream leakage, claims should know.
Leakage on the premium side, too
Everything above treats leakage as cost paid that should not have been. There is a mirror version of the problem: premium that was never charged. Exposure under-rated because the submission was incomplete. A vehicle, driver or occupancy change that never reached the policy record at renewal. A discount applied without verification. A class code that stopped matching the operation two years ago and nobody noticed because nothing broke. Same mechanism as claims leakage — a data gap nobody owned — measured on the other side of the ledger.
The fix rhymes as well. Verify at issuance against real sources rather than trusting a form; refresh the policyholder record on a schedule instead of at renewal panic; and surface anomalies as alerts during the term rather than as findings in an audit. Get both sides running and the feedback loop closes properly: claims outcomes inform pricing and appetite, and cleaner policy data makes the claims analysis easier to trust in the first place.
That feedback loop is where insurance claims analytics stops being a reporting function and becomes a margin protection engine.
Frequently Asked Questions
What is insurance claims analytics? Insurance claims analytics is the use of claims, workflow, document, payment, vendor, and external data to identify patterns that affect cost, speed, fraud risk, recovery, and customer experience.
How does insurance claims analytics reduce leakage? It reduces leakage by spotting abnormal patterns early, such as late reserve movement, duplicate invoices, rental overrun, missed subrogation, high supplement rates, or litigation escalation signals. The value comes when those insights trigger clear actions.
Where does hidden claims leakage usually occur? Hidden leakage often appears in vendor invoices, supplements, rental and storage charges, missed deductibles, delayed tasks, poor recovery handling, under-reserving, reopened claims, and attorney demand management.
Does claims analytics replace adjusters? No. Good analytics supports adjusters by surfacing relevant facts, prioritizing work, and reducing manual hunting. Human judgment remains essential for coverage, liability, negotiation, empathy, and complex claim decisions.
What data is needed to find claims leakage? Useful data includes FNOL details, policy and coverage data, adjuster notes, payments, reserves, invoices, photos, repair estimates, attorney correspondence, vendor activity, recovery data, and workflow timestamps.
How quickly can insurers see value from claims analytics? Many insurers can start with a focused leakage sprint in 30 days if the scope is narrow and the data sources are available. Larger programs take longer, especially when multiple systems, teams, and lines of business are involved.
Ready to find the leakage hiding in plain sight?
If claims leakage feels like a foggy number rather than a managed process, start with one workflow and one measurable leakage question.
Inaza helps insurers, MGAs, and brokers automate claims workflows, capture operational data, enrich files through integrations, and turn that data into real-time analytics dashboards. The result is faster action, cleaner insight, and fewer expensive surprises hiding inside normal-looking claims.
Explore Inaza to see how connected claims automation and analytics can help reveal hidden leakage before it drains your margin.