Florida insurance claims outlook, Q3 2026: what changed and our forecasts to mid-2027
Data period: Q3 2026 (July to September); BLS CPI through October 2026; OIR rate data as of October 2026; Hurricane Isaias data to 6 November 2026; forecasts to June 2027
Florida enters 2027 with the best auto results in the country and the fastest-falling rates. The Office of Insurance Regulation (OIR) puts the 2025 personal auto liability loss ratio at 52.5% (favorable for insurers), the lowest in 15 years, and the top five auto groups at a 2026 indicated rate change of -12.6% [1]. Our view is that this is the high point of the cycle. Repair prices are still rising at close to 6% a year and our forecast has them faster by December, while the insurance price index keeps falling. That gap is where Florida auto margins will narrow through 2027.
Property has a different shape. One hurricane in a historically quiet season, Isaias, produced about 68,000 claims and $736 million of insured losses five weeks after landfall [2][3], and Southeast Florida then had two flood events in November [4]. Homeowners rates are falling too [5].
Every forecast below has a central number, an 80% range, the method and the source. The data notes matter: the U.S. Bureau of Labor Statistics (BLS) did not collect October 2025 prices, so that month is interpolated in the index before forecasting and October 2026 year-on-year changes are not quoted.
Key findings
- Executive
Florida auto starts 2027 from a 52.5% (favorable for insurers) liability loss ratio, but our illustration of forecast repair costs against a falling price index adds around 7 points (adverse for insurers) to a book at that level. This is the high point of the cycle, not the new normal.
- Claims
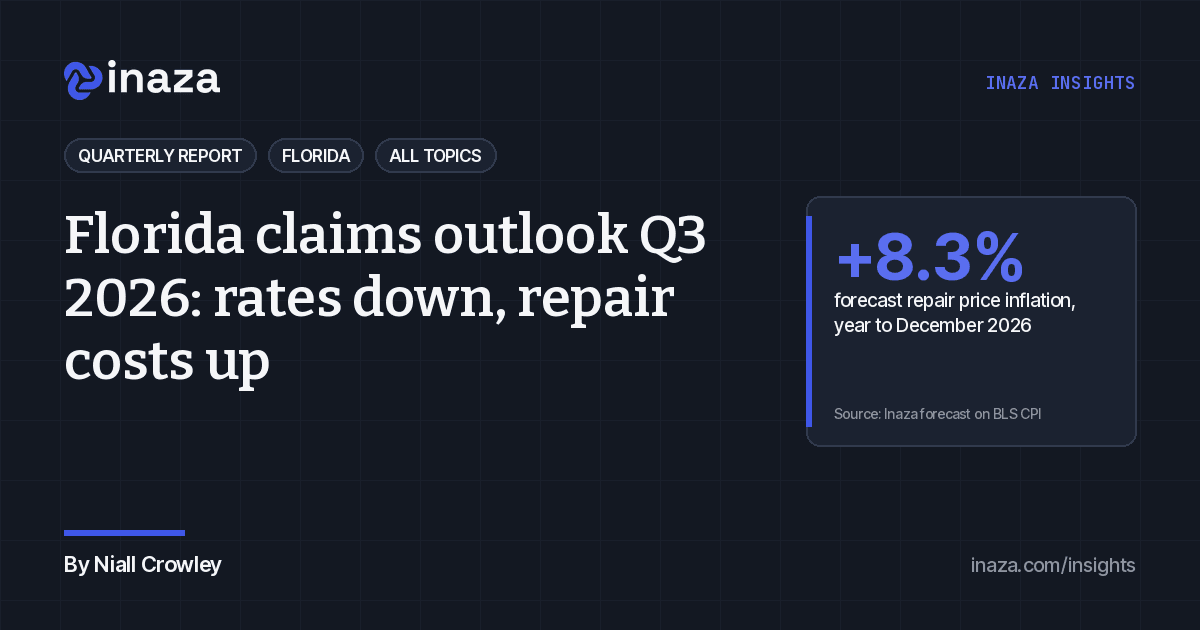
Motor vehicle repair prices are forecast up +8.3% (adverse for insurers) in the year to December 2026 (80% range +7.4% to +9.1%), partly a base effect, with the underlying trend a little above 6%. Parts are forecast at only +1.4%.
- Underwriting
The motor vehicle insurance price index is forecast at -5.0% in December 2026, and OIR's top five auto groups show a -12.6% indicated change. Expect Florida filings at or below zero through the first half of 2027.
- Executive
Hurricane Isaias, the only Atlantic hurricane of 2026, produced about 68,000 claims and $736 million of insured losses in five weeks, and November floods add a water and flooded-vehicle tail in the southeast.
What you can do about this
For executives
- 1
Personal auto
Plan 2027 on a rising auto loss ratio from a record-low base
Repair prices forecast at 8.3% (adverse for insurers) against an insurance price index at -5.0% moves an illustrative 52.5% book to about 59.8% (adverse for insurers). Set 2027 targets on that path, not on 2025 results.
For claims teams
- 1
Personal auto
Automate repair estimate checks against current labour rates
Labour-heavy repair is running near 6% a year underneath the December base effect, while parts are near 1.4%. Flag estimates with labour hours or rates above your benchmarks.
- 2
Property
Separate repeat-event storm and flood claims at first notice
Isaias in October and two Southeast Florida flood events in November overlap in the fourth quarter. Date-of-loss and prior-damage evidence decides which event pays.
For underwriters
- 1
Personal auto
Re-rate renewals before passing on average decreases
With the insurance index forecast at -5.0%, check which segments have the highest repair share before applying flat decreases.
The forecasts in brief
Forecast | Central | 80% range | Method | Source |
|---|---|---|---|---|
Motor vehicle maintenance and repair CPI, YoY Dec 2026 | +8.3% (adverse for insurers) | +7.4% to +9.1% | 12-month log trend, backtested | BLS [6] |
Motor vehicle maintenance and repair CPI, YoY Jun 2027 | +7.3% (adverse for insurers) | +4.9% to +9.4% | Same | BLS [6] |
Motor vehicle insurance CPI, YoY Dec 2026 | -5.0% | -7.0% to -3.5% | Same | BLS [7] |
Motor vehicle insurance CPI, YoY Jun 2027 | -3.2% | -9.8% to +2.5% | Same, wide errors | BLS [7] |
Motor vehicle parts and equipment CPI, YoY Dec 2026 | +1.4% | +0.3% to +2.4% | Same | BLS [8] |
Used cars and trucks CPI, South region, YoY Dec 2026 | -1.3% (favorable for insurers) | -5.9% to +1.5% | Same | BLS [9] |
Medical care CPI, South region, YoY Dec 2026 | +1.9% | +1.0% to +2.7% | Same | BLS [10] |
Repair, parts and the insurance index are U.S. city averages; BLS does not publish them for Florida. Used vehicles and medical care are for the South census region, which includes Florida.
Want the next report when it comes out? We can email it to you.
Subscribe1. The quarter in numbers
Measure | Latest | Period | Source |
|---|---|---|---|
Personal auto liability loss ratio, Florida | 52.5% (favorable for insurers) | 2025 | OIR [1] |
Top five auto groups, 2026 indicated rate change | -12.6% | 2026, as of fall | OIR [1] |
Motor vehicle maintenance and repair CPI | +5.8% (adverse for insurers) | YoY Sep 2026 | BLS [6] |
Motor vehicle insurance CPI | -5.0% | YoY Sep 2026 | BLS [7] |
Used cars and trucks CPI, South | -3.0% (favorable for insurers) | YoY Oct 2026 | BLS [9] |
Homeowners receiving October rate decreases | more than 824,300 | October 2026 | OIR and DFS [5] |
Hurricane Isaias, claims and insured losses | about 68,000 and $736 million | OIR data to 6 Nov 2026 | OIR via Insurance Journal [3] |
The third quarter itself was quiet for Florida claims. The cost pressure built through the summer: the repair index rose about 2.4% (adverse for insurers) between June and September alone [6]. Isaias arrived on 9 October, so its losses sit in the fourth quarter.
2. Forecasts for Q4 2026 to mid-2027
2.1 Claim severity
Year-on-year change, actual to Oct 2026, then central forecast with 80% range to Jun 2027
Source: U.S. Bureau of Labor Statistics CPI CUUR0000SETD and CUUR0000SETC; Inaza forecast, as of November 18, 2026
Our central forecast has motor vehicle maintenance and repair prices up +8.3% (adverse for insurers) in the year to December 2026, easing to +7.3% (adverse for insurers) by June 2027. Part of the December figure is a base effect: the index dipped in December 2025, so the year-on-year comparison flatters later months. The underlying trend is still a little above 6% a year. Parts prices are flat by comparison, at +1.4%, so the pressure is in labour and services rather than the components themselves [6][8].
Used vehicle prices in the South are forecast at -1.3% (favorable for insurers) in December, with a wide range that includes a small rise [9]. A softer used market lowers total loss settlements, which partly offsets repair inflation on the physical damage side. Medical care prices in the South are forecast at +1.9%, low enough that personal injury protection severity is driven more by utilisation and litigation than by price [10].
2.2 Premium and rate trend
Year-on-year change, actual to Oct 2026, then central forecast with 80% range to Jun 2027
Source: U.S. Bureau of Labor Statistics CPI CUUR0000SETE and CUUR0300SETA02; Inaza forecast, as of November 18, 2026
The motor vehicle insurance price index is forecast at -5.0% in December 2026, with an 80% range of -7.0% to -3.5% [7]. By mid-2027 the range widens to include a small rise, because the index can turn quickly once filings change direction. OIR's indicated rate changes point the same way for Florida specifically, and OIR says it is asking insurers for more rate relief [1]. We expect Florida filings to stay at or below zero through the first half of 2027.
2.3 Catastrophe and weather
The 2026 Atlantic season ends on 30 November with 10 named storms and one hurricane, the first single-hurricane season since 1925, which researchers at Florida Atlantic University attribute to a historically strong El Niño [2]. We do not forecast the 2027 hurricane season in this edition: no public seasonal forecast is available yet, and the first official outlooks come in the spring.
Near term, the risk is water, not wind. Southeast Florida had two heavy rain events in three weeks in November, including NWS estimates of 8 to 10 inches in three hours over parts of Broward County on 17 November, as reported by NBC 6 [4]. Expect flooded-vehicle and commercial water claims in the fourth quarter on top of the Isaias development.
2.4 Regulation with known dates
OIR says more homeowners rate decreases are pending for November, December and January, covering about 450,000 more policyholders [5]. We have not found a Florida auto or property rule change with a fixed effective date in the next quarter that would change claim costs; if one is published, the next edition will add it.
Monthly reports and live alerts, by email, when you want them.
Subscribe3. What it means for loss ratio and combined ratio
Personal auto
As an illustration only: a book at the 2025 Florida liability loss ratio of 52.5%, whose claim costs rose in line with our December repair forecast (+8.3%) while its average premium fell in line with the insurance index forecast (-5.0%), would move to about 59.8% (adverse for insurers), a rise of around 7 points (adverse for insurers). Real books differ by coverage mix, and repair costs drive physical damage more than liability, so treat this as direction and scale, not a Florida forecast.
Commercial auto
The same repair pressure applies. OIR's public rate statements cover personal auto [1]; we have not found an equivalent public figure for commercial auto, so we do not assume the same decreases there.
Commercial and residential property
Rate decreases in homeowners [5], an Isaias loss of a similar size to Hurricane Sally five weeks after landfall [3], and a flood tail in the southeast leave less room for adverse development. The fourth quarter will carry most of the 2026 catastrophe cost.
Summary
Line | Cost path to mid-2027 | Price path | Loss ratio reading |
|---|---|---|---|
Personal auto | Repair +7% to +8% (adverse for insurers), used vehicles flat to lower | Insurance CPI -5.0%, OIR indicated -12.6% | Rising from a record-low base |
Commercial auto | Repair pressure as personal auto | No public Florida figure | Moderate pressure |
Property | Isaias and November floods in Q4 | Homeowners decreases | Thinner margin for development |
The point estimates come from our model or the official figures cited. The ratings are our judgment.
4. Methodology
- Forecasts. For each series we project the log index forward at the mean monthly log change over the 12 months to October 2026, then convert to a year-on-year change against the official index 12 months earlier.
- Ranges. We backtest the same method at every forecast origin from January 2015 for horizons of 1 to 12 months and take the 10th and 90th percentiles of the errors as the 80% range.
- Data gaps. BLS did not collect October 2025 prices (and November 2025 for the insurance index). Those months are linearly interpolated in the index before forecasting and are never quoted as data.
- Regional coverage. BLS publishes repair, parts and insurance indexes nationally, not for Florida. Florida-specific evidence comes from OIR and the Department of Financial Services.
- Reproducibility. The data fetch, forecasts and charts are produced by scripts that rerun each quarter on the latest official releases.
Get a note when something in this market changes.
SubscribeHow Inaza can help
The steps above can be run with your own teams. Where volume makes manual checks hard, Inaza can take on the routine work:
- Automate repair estimate checks against current labour rates. Inaza reads estimates and supplements as they arrive and flags line items above the rates you set, so adjusters review the outliers.
- Re-rate auto renewals on current claim cost data. Inaza brings policy, vehicle and claim data together at renewal so underwriters can see which segments a rate decrease leaves short.
- Separate repeat-event storm and flood claims early. Inaza checks dates, photos and prior claims at first notice so overlapping events are untangled before payment.
To see how this would work on your own book, talk to the Inaza team.
Sources
- 1. Florida Office of Insurance Regulation, Commissioner approves -7% auto rate decrease, impacting more than 498,000 policies, news release, 26 Oct 2026.
- 2. Florida Atlantic University, El Nino held the Atlantic to one hurricane in 2026, fewest since 1925, news release, 16 Nov 2026.
- 3. Insurance Journal, Five weeks after Isaias, 68,000 claims and $736M in losses, Florida carrier data show (Florida OIR data updated 6 Nov 2026), 10 Nov 2026.
- 4. NBC 6 South Florida, Flood watch for Broward and Miami-Dade (citing NWS Miami), 17 Nov 2026.
- 5. Florida Department of Financial Services and Office of Insurance Regulation, Major rate decreases for homeowners effective this month, news release, 29 Oct 2026.
- 6. U.S. Bureau of Labor Statistics, CPI-U series CUUR0000SETD, motor vehicle maintenance and repair, U.S. city average, not seasonally adjusted. Retrieved 18 Nov 2026.
- 7. U.S. Bureau of Labor Statistics, CPI-U series CUUR0000SETE, motor vehicle insurance, U.S. city average, not seasonally adjusted. Retrieved 18 Nov 2026.
- 8. U.S. Bureau of Labor Statistics, CPI-U series CUUR0000SETC, motor vehicle parts and equipment, U.S. city average, not seasonally adjusted. Retrieved 18 Nov 2026.
- 9. U.S. Bureau of Labor Statistics, CPI-U series CUUR0300SETA02, used cars and trucks, South region, not seasonally adjusted. Retrieved 18 Nov 2026.
- 10. U.S. Bureau of Labor Statistics, CPI-U series CUUR0300SAM, medical care, South region, not seasonally adjusted. Retrieved 18 Nov 2026.
Subscribe to Inaza Insights
Get the monthly reports, the quarterly outlook and live alerts by email.