Texas hail and storm claims, October 2026: a quiet month with a sharp Panhandle day
Updated:
Data period: October 2026, full month (NOAA SPC preliminary reports); baselines from the SPC severe weather database, 2016 to 2025
October was below average for hail and wind across Texas. Most of the month's hail and wind came in two days, 13 and 14 October, mainly over the Panhandle and Rolling Plains, and a second round of tornadoes hit West and South Texas on 29 October. That pattern, few reports but large stones in rural counties, is typical of fall and matters more for agricultural and rural auto books than for the big metros.
What you can do about this
- 1
Pre-stage DFW, Amarillo and Austin capacity before March
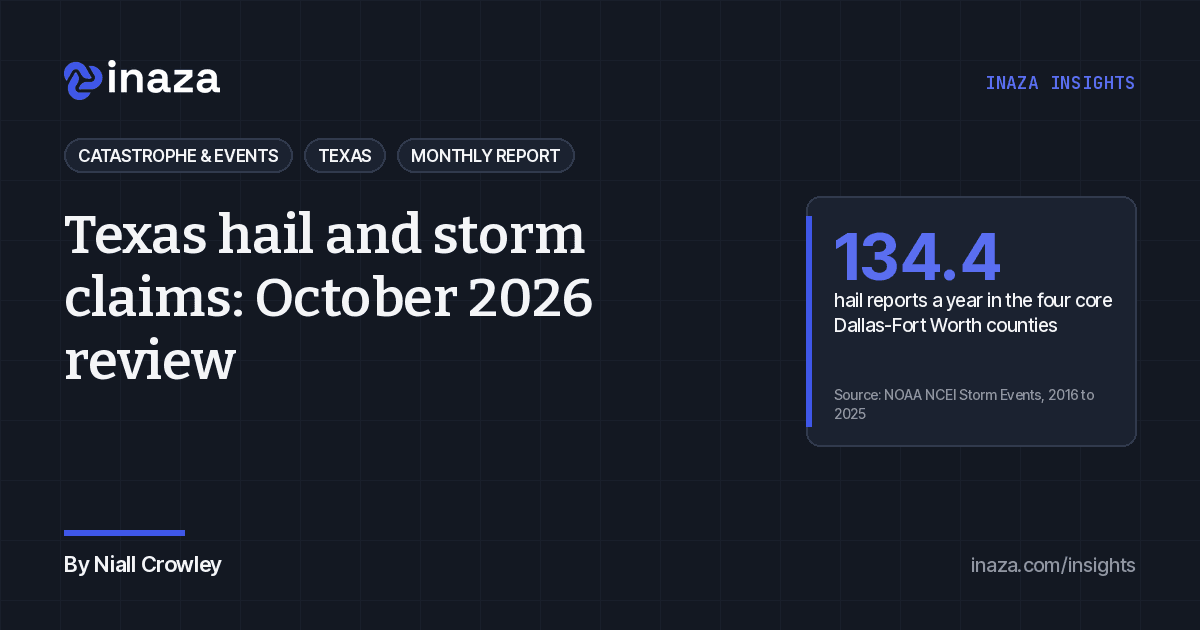
Texas averaged 156 hail reports in March, 342 in April and 470 in May from 2016 to 2025. The four core Dallas-Fort Worth counties averaged 134.4 hail reports a year, more than any other Texas metro in the list, and had 7.19 million residents in 2024. Agree surge capacity with adjusters and repair networks now.
- 2
Size a DFW hail day by vehicle and roof density, not report counts
A single storm over Collin or Tarrant can generate more auto physical damage claims than a month of Panhandle hail. Use in-force vehicle and roof counts in Dallas, Tarrant, Collin and Denton to size surge, not the SPC report total.
- 3
Set county binding pauses when hail reaches 2 inches
Five of the 11 Texas hail reports in October 2026 were 2 inches or larger, against an October average of 1.5. The largest stones, 2.75 inches, were reported in Motley and Wheeler counties. Decide in advance when new business and coverage changes pause in a county, and when the pause lifts.
- 4
Automate claim pre-opening at 1-inch hail over a policy location
October's hail and wind were concentrated on 13 and 14 October in the Panhandle and Rolling Plains, a pattern that matters more for agricultural and rural auto books than for the big metros. Matching SPC reports of 1 inch or more to policy locations overnight opens claims before the first customer call.
October against the 10-year baseline
Texas storm reports in October: 2026 preliminary, full month, vs 2016-2025 average
Source: NOAA Storm Prediction Center filtered storm reports (spc.noaa.gov/climo/reports) and SPC severe weather database 2016-2025 (spc.noaa.gov/wcm), as of October 31, 2026
SPC logged 11 (favorable for insurers) preliminary hail reports in Texas in October 2026, against an October average of 17.2 for 2016 to 2025 [1][2]. Thunderstorm wind reports were 26 (favorable for insurers) against an average of 39.8 [1][2]. There were 8 (adverse for insurers) tornado reports, compared with an average of 5.0 [1][2]. Five (adverse for insurers) hail reports were 2 inches or larger, against an October average of 1.5 [1][2].
The largest stones, 2.75 inches, were reported in Motley and Wheeler counties on 13 October [1]. Hail of 2 inches or more was also reported in Donley, Lipscomb and Jeff Davis counties [1]. Three tornado reports came from Pecos County on 14 October and five on 29 October from Culberson, Uvalde and Kinney counties [1]. None of the October hail reports came from the Dallas-Fort Worth, Houston, San Antonio or Austin core counties [1].
A note on method. Preliminary SPC reports are not the final record. Some reports are merged or removed when NOAA finalizes the data, and tornado reports in particular are often revised down. We compare preliminary 2026 counts with final counts for earlier years, so small gaps should be read with care.
Want the next report when it comes out? We can email it to you.
SubscribeWhere we are in the hail year
Average Texas hail reports per month, 2016-2025, with 10th and 90th percentile years
Source: NOAA SPC severe weather database 2016-2025 (spc.noaa.gov/wcm), as of December 31, 2025
Texas hail is heavily seasonal. Over 2016 to 2025 the state averaged 470 hail reports in May and 342 in April, against 16.8 in November and 8.6 in December [2]. The quiet period runs to February. Reports climb sharply in March, which averaged 156 [2].
For claims teams this means the next three months are the window to clear backlog, review vendor capacity and test catastrophe playbooks before the spring season.
Exposure is concentrated in North Texas
Average hail reports per year in core metro counties, 2016-2025
Source: NOAA NCEI Storm Events Database bulk files 2016-2025 (ncei.noaa.gov/pub/data/swdi/stormevents/csvfiles), as of December 31, 2025
The four core Dallas-Fort Worth counties (Dallas, Tarrant, Collin and Denton) averaged 134.4 hail reports a year from 2016 to 2025, more than any other Texas metro in our list [3]. Those four counties had 7.19 million residents in the Census Bureau's 2024 estimates [4]. Amarillo (36.8 a year) and Austin (35.5) come next [3].
When a large hail day hits DFW, the claim count is driven by vehicle and roof density, not by the number of reports. A single storm over Collin or Tarrant can generate more auto physical damage claims than a month of Panhandle hail.
Monthly reports and live alerts, by email, when you want them.
SubscribeFlood and fire declarations
The summer's flooding is still working through the system. FEMA approved major disaster declaration DR-4935 on 1 September 2026 for severe storms, straight-line winds, tornadoes and flooding that began on 12 July [5]. It covers 26 counties, including Bexar, Kerr, Comal, Kendall and Uvalde, with both individual and public assistance [5]. An emergency declaration, EM-3649, was issued on 18 July for 33 counties [5].
FEMA approved fire management assistance for the Ross Fire on 25 August and the Hydra Fire on 15 September [5].
What this means for underwriting and claims
Underwriting. The October data does not change the risk picture. North Texas remains the largest concentration of hail exposure. Spring 2027 renewals and new business in DFW, Amarillo and Austin carry the most seasonal hail risk.
Claims. A quiet fall is the time to set up for spring. Useful steps:
- map in-force vehicles and properties against hail history at county and ZIP level;
- agree surge capacity with repair networks and adjusters before March;
- set rules to open and triage claims automatically when SPC reports hail of 1 inch or more over insured locations.
Get a note when something in this market changes.
SubscribeHow Inaza can help
Every action above can be run with your own teams and tools. Where volume makes manual checks hard, Inaza can take on the routine work. Mapped to the actions:
- Pre-stage DFW, Amarillo and Austin capacity before March. Estimate likely claim volume by county from your in-force exposure and hail history, so capacity goes where it is needed.
- Size a DFW hail day by vehicle and roof density, not report counts. Match SPC reports to in-force counts at county and ZIP level and produce a surge estimate as soon as the reports arrive.
- Set county binding pauses when hail reaches 2 inches. Apply the binding pause the moment a 2-inch trigger fires in a county and lift it when the event clears.
- Automate claim pre-opening at 1-inch hail over a policy location. Match SPC reports to policy locations within hours and start outreach and pre-opening automatically.
To see how this would work on your own book, talk to the Inaza team.
Sources
- 1. NOAA Storm Prediction Center, daily filtered storm reports, 1 to 31 Oct 2026 (preliminary). https://www.spc.noaa.gov/climo/reports/
- 2. NOAA Storm Prediction Center, severe weather database files 2016 to 2025 (hail, wind, tornado). https://www.spc.noaa.gov/wcm/ Retrieved 13 Nov 2026.
- 3. NOAA NCEI, Storm Events Database bulk files 2016 to 2025, county-level hail events. https://www.ncei.noaa.gov/pub/data/swdi/stormevents/csvfiles/
- 4. U.S. Census Bureau, county population estimates (POPESTIMATE2024). https://www.census.gov/programs-surveys/popest.html
- 5. OpenFEMA, Disaster Declarations Summaries v2, Texas. https://www.fema.gov/api/open/v2/DisasterDeclarationsSummaries
Subscribe to Inaza Insights
Get the monthly reports, the quarterly outlook and live alerts by email.