Texas insurance claims outlook, Q3 2026: what changed and our forecasts to 2027
Updated:
Data period: Q3 2026 (July to September); price indexes through September 2026; NOAA SPC preliminary storm reports through 31 October 2026 and NCEI records through July 2026; regulatory status as of 13 November 2026; forecasts to December 2027
Updated 13 Nov 2026: After this report was published, TDI adopted the SB 458 appraisal rules (28 TAC 5.9800 to 5.9806) in Commissioner's Order 2026-10210, issued on 6 November 2026. The adopted rules apply to personal auto and residential property policies delivered, issued for delivery or renewed on or after 1 March 2027, later than the 1 September 2026 date in the proposal [25]. The regulatory sections below now reflect the adopted rules. We also updated the legal services figures to the latest BLS data, 7.4% in the year to September, which moves the legal services score to 62.6 and the personal and commercial auto line scores to 56.9 and 53.5.
Q3 2026 left Texas insurers with more claim cost pressure than a normal quarter, and the pressure is not where most people look. Repair and medical inflation have cooled from their peaks, but legal costs, hospital costs and construction materials are running hot. The motor vehicle insurance price index fell 5.0% over the year. Severe weather was the second most active Q3 in Texas in the last decade, and July brought major flooding for the second year in a row.
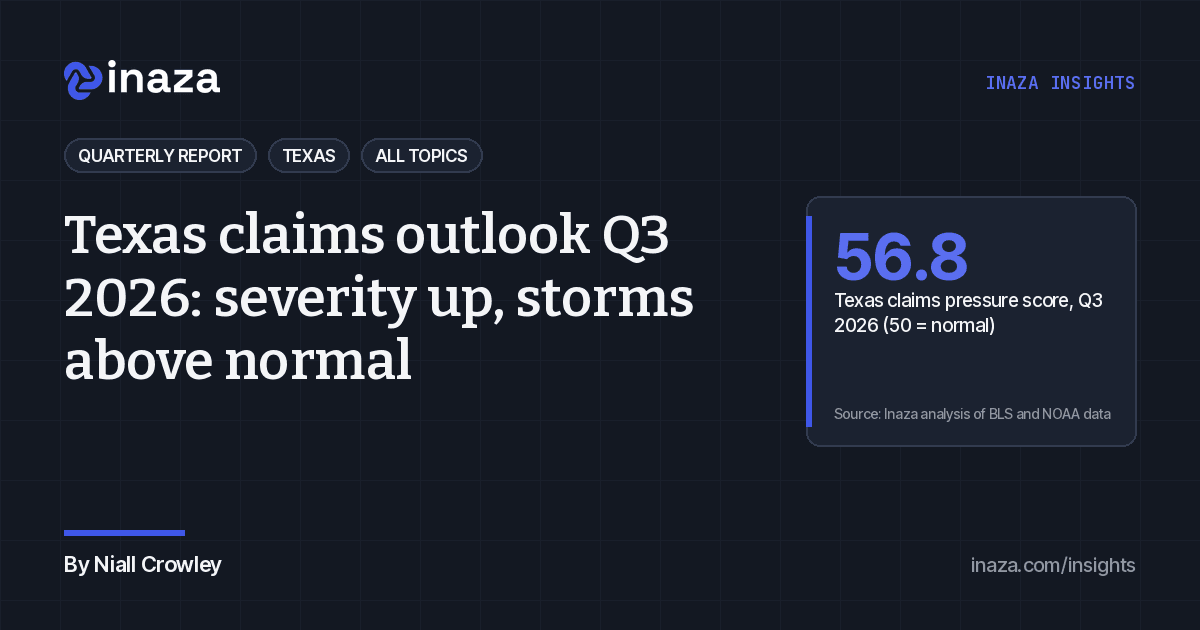
Our Texas claims pressure score for Q3 2026 is 56.8 (adverse for insurers), where 50 is normal. Commercial property is under the most pressure at 61.0 (adverse for insurers), then personal auto at 56.9 (adverse for insurers) and commercial auto at 53.5 (adverse for insurers).
This quarterly adds forecasts to that review. Every forecast has a central number, an 80% range, the method and the source. The short version: claim costs keep rising faster than prices into 2027, frequency keeps easing but not by enough, spring hail is the main catastrophe risk, and the hurricane season is effectively over for Texas.
What you can do about this
- 1
Re-base injury reserves on legal and hospital costs
Legal services rose 7.4% (adverse for insurers) and hospital services 5.4% (adverse for insurers) in the year to September, against 1.5% for medical care overall. Use those lines, not headline medical CPI, in bodily injury reserve factors, with a separate assumption for Dallas-Fort Worth.
- 2
Track the gap between personal auto claim costs and price
Personal auto claim costs are forecast to rise 6.6% (adverse for insurers) to December 2026 while the motor vehicle insurance CPI falls 4.8%. That is about +4.0 points (adverse for insurers) of personal auto loss ratio pressure in the 12 months to December 2026. Review rate adequacy where filed rates are flat or falling.
- 3
Plan Q2 2027 hail capacity for the 90th percentile
That is 1,308 Texas hail reports and 260 reports of 2-inch or larger hail. Agree adjuster and repair capacity and county moratorium triggers before March.
- 4
Check commercial property insured values against the rebuild-cost forecast
Rebuild costs are forecast to rise 7.9% (adverse for insurers) to December 2026, against 2.1% for the commercial multiple peril price index, or about +3.7 points (adverse for insurers) of pressure before catastrophe losses. The 2027 forecast is 5.6% (adverse for insurers). Compare insured values with current rebuild costs at every renewal.
- 5
Prepare for the SB 458 appraisal rules before 1 March 2027
The rules, adopted on 6 November 2026, apply to personal auto and residential property policies delivered, issued for delivery or renewed from 1 March 2027. They require appraisal notices in claim decision letters and deadline tracking, which adds expense-ratio work. Refile policy forms and build the clocks before that date.
The forecasts in brief
Forecast | Central | 80% range | Method | Source |
|---|---|---|---|---|
Personal auto claim cost basket, YoY Dec 2026 | +6.6% (adverse for insurers) | +5.8% to +7.7% | Trend and ARIMA ensemble, backtested | BLS [1][2] |
Personal auto claim cost basket, YoY Dec 2027 | +4.3% (adverse for insurers) | +3.0% to +8.2% | Same | BLS [1][2] |
Vehicle repair CPI, YoY Dec 2026 | +8.1% (adverse for insurers) | +7.4% to +9.4% | Same | BLS [1] |
Legal services PPI, YoY Dec 2026 | +8.4% (adverse for insurers) | +7.3% to +10.5% | Same | BLS [2] |
Commercial property rebuild cost basket, YoY Dec 2027 | +5.6% (adverse for insurers) | +0.5% to +12.4% | Same | BLS [3][15] |
Texas injury rate per 100 million miles, 2027 | 75.3 (favorable for insurers) | 72.8 to 77.9 | Log-linear trend, 2016 to 2025 | TxDOT [10][12] |
Texas vehicle miles traveled, 2026 | 317 billion | 311.5 to 323 billion | Regression on U.S. year-to-date miles | TxDOT, FHWA [10][13] |
Motor vehicle insurance CPI, YoY Dec 2026 | -4.8% | -6.5% to -2.0% | Trend and ARIMA ensemble | BLS [1] |
Texas hail reports, Q2 2027 | 1,004 | 622 to 1,308 | 2016 to 2025 climatology, El Niño tested | NOAA SPC, CPC [5][20] |
Texas tropical landfall, 31 Oct to 30 Nov 2026 | Close to zero (favorable for insurers) | None in 175 seasons | Historical frequency | NOAA HURDAT2 [21] |
Personal auto loss ratio pressure, 12 months to Dec 2026 | +4.0 points (adverse for insurers) | +0.7 to +8.1 points | Cost, frequency and price model | Inaza model, TDI [18] |
¿Quieres el próximo informe cuando salga? Te lo podemos enviar por email.
Suscribirse1. Quarter in numbers
Measure | Q3 2026 reading | Normal (baseline) | Source |
|---|---|---|---|
Motor vehicle repair CPI, YoY (Sep) | +5.8% | +5.8% average, Sep 2018 to 2025 | BLS [1] |
Body work CPI, YoY (Sep) | +6.0% (adverse for insurers) | BLS [1] | |
Parts and equipment CPI, YoY (Sep) | +0.8% (favorable for insurers) | +3.6% average | BLS [1] |
Medical care CPI, Dallas-Fort Worth, YoY (Sep) | +4.4% (adverse for insurers) | +2.4% average | BLS [1] |
Medical care CPI, U.S., YoY (Sep) | +1.5% | +2.6% average | BLS [1] |
Legal services PPI, YoY (Sep) | +7.4% (adverse for insurers) | +4.9% average, Sep 2017 to 2025 | BLS via FRED [2] |
Construction materials PPI, YoY (Sep) | +11.0% (adverse for insurers) | +5.6% average | BLS via FRED [3] |
Motor vehicle insurance CPI, YoY (Sep) | -5.0% | BLS [1] | |
Texas hail and wind reports, Jul to Sep | 333 (adverse for insurers) (preliminary) | 255.4 average, 2016 to 2025 | NOAA SPC [4][5] |
Texas flood events, July | 160 (adverse for insurers) | 39.1 average, July 2016 to 2025 | NOAA NCEI [6] |
FEMA major disaster declarations, Texas | 1 (DR-4935, 26 counties) | OpenFEMA [7] | |
Authorized automated vehicles, Texas | 3,164 (29 Oct report) | TxDMV [9] |
Three things stand out.
Severity is moving, frequency is not. Texas road deaths fell 9.38% in 2025 while miles driven rose 1.79%, taking the fatality rate to 1.20 per 100 million miles, the lowest in our 2016 to 2025 series [10]. The pressure is in what each claim costs.
Deaths per 100 million vehicle miles traveled, Texas
Fuente: TxDOT, Comparison of Motor Vehicle Traffic Deaths 2003-2025 (txdot.gov), a fecha de April 7, 2026
Legal and hospital costs lead. Legal services prices rose 7.4% (adverse for insurers) and hospital services 5.4% (adverse for insurers) over the year to September, against 1.5% for medical care overall [1][2]. Bodily injury severity follows these lines more closely than it follows headline medical CPI.
Year-on-year change, U.S., %
Fuente: U.S. Bureau of Labor Statistics CPI-U, not seasonally adjusted (api.bls.gov); BLS PPI PCU541110541110 via FRED, a fecha de September 30, 2026
Weather was above normal. SPC logged 333 (adverse for insurers) preliminary hail and thunderstorm wind reports in Texas in Q3, more than any Q3 since 2016 except 2023 (520) [4][5]. Wind made up 284 (adverse for insurers) of them, against a Q3 average of 190.8 [4][5]. Hail was below normal at 49 (favorable for insurers) reports, against 64.6 [4][5].
Texas hail and thunderstorm wind reports, July to September
Fuente: NOAA SPC severe weather database 2016-2025; *2026 SPC preliminary filtered reports, a fecha de September 30, 2026
July flooding was extreme. NOAA's Storm Events database records 160 (adverse for insurers) flood and flash flood events in Texas in July 2026, after 186 (adverse for insurers) in July 2025 [6]. No other July from 2016 to 2024 had more than 99 [6]. NOAA's property damage estimate for July 2026 flood and flash flood events is $172.4 million, and it records 4 direct deaths from flash flooding [6]. NOAA damage estimates are partial and are not insured loss figures. FEMA declared a major disaster, DR-4935, on 1 September for 26 counties in the Hill Country, South Texas and the Edwards Plateau [7].
Texas flood and flash flood events in July, NOAA Storm Events
Fuente: NOAA NCEI Storm Events Database (2026 file c20261026, data through July 2026), a fecha de July 31, 2026
2. Texas claims pressure scorecard
The scorecard is a simple, open index. Each component is scored against its own history. A score of 50 means the component is at its normal level. Each 10 points above or below 50 is one standard deviation from normal. The Texas score is the plain average of the components.
Score per component: 50 = the component's own recent normal, each 10 points = one standard deviation
Fuente: Inaza analysis of BLS CPI and PPI, NOAA SPC and NCEI data; see methodology, a fecha de September 30, 2026
Component | Measure | Q3 2026 | Baseline mean | Baseline SD | Score |
|---|---|---|---|---|---|
Auto repair cost | U.S. CPI motor vehicle maintenance and repair, Sep YoY | 5.8% | 5.8% | 3.4 | 49.8 |
Parts cost | U.S. CPI motor vehicle parts and equipment, Sep YoY | 0.8% | 3.6% | 4.6 | 44.0 (favorable for insurers) |
Medical cost | Dallas-Fort Worth CPI medical care, Sep YoY | 4.4% | 2.4% | 2.6 | 57.7 (adverse for insurers) |
Legal services cost | U.S. PPI offices of lawyers, Sep YoY | 7.4% | 4.9% | 1.9 | 62.6 (adverse for insurers) |
Construction materials | U.S. PPI construction materials, Sep YoY | 11.0% | 5.6% | 9.4 | 55.8 (adverse for insurers) |
Severe storm reports | Texas hail and wind reports, Jul to Sep | 333 | 255.4 | 115.8 | 56.7 (adverse for insurers) |
Flood events | Texas flood and flash flood events, July | 160 | 39.1 | 58.7 | 70.6 (adverse for insurers) |
Texas composite | 56.8 (adverse for insurers) |
Sources: [1] to [6]. Baselines: CPI components use September readings for 2018 to 2025, PPI components use 2017 to 2025, storm and flood components use 2016 to 2025.
Texas versus the U.S.
Six components can be measured for both Texas and the U.S. Four use national price indexes for both, because BLS does not publish Texas indexes for repair, parts, legal services or construction materials. The two that differ are medical cost (Dallas-Fort Worth against the U.S.) and severe storms (Texas reports against all U.S. reports).
Pressure score, Q3 2026. Medical uses Dallas-Fort Worth CPI for Texas; storms use Texas-only reports
Fuente: Inaza analysis of BLS CPI and PPI and NOAA SPC data, a fecha de September 30, 2026
On these six shared components Texas scores 54.4 (adverse for insurers) and the U.S. scores 52.8 (adverse for insurers). The gap comes from medical costs: Dallas-Fort Worth medical inflation scored 57.7 (adverse for insurers) against 45.2 (favorable for insurers) for the U.S. Severe weather was above normal in both, with 11,966 preliminary U.S. hail and wind reports in Q3 against a 2016 to 2025 average of 9,690.9 [4][5]. Flood is excluded from the comparison because we do not yet have a like-for-like national July series.
Pressure by line
Average component score per line, Q3 2026 (50 = normal)
Fuente: Inaza analysis; component mapping in the methodology section, a fecha de September 30, 2026
Line | Components used | Score |
|---|---|---|
Personal auto | Repair, parts, medical, legal, severe storms, flood | 56.9 (adverse for insurers) |
Commercial auto | Repair, parts, medical, legal | 53.5 (adverse for insurers) |
Commercial property | Construction materials, severe storms, flood | 61.0 (adverse for insurers) |
Informes mensuales y alertas en vivo, por email, cuando las quieras.
Suscribirse3. Forecasts for Q4 2026 and 2027
The review above covers what happened. This section covers what we expect next. All forecasts use public data and methods we can show in full. Each one gives a central number and an 80% range: we expect the outcome to land inside the range four times in five.
3.1 Claim cost and severity
Expected year-on-year change, %, central forecast and 80% range
Fuente: Inaza model on BLS CPI, PPI and Current Employment Statistics data, a fecha de October 30, 2026
We forecast each cost index with two simple models and average them. The first carries the last 12 months' average rate of change forward. The second is an ARIMA model, a standard statistical model that learns from the series' own recent pattern. We tested the combined forecast on every month from January 2012 and set each range from the errors it made in that test (162 test points at the longest horizon).
Measure (YoY) | Latest (Sep 2026) | Dec 2026 | Jun 2027 | Dec 2027 |
|---|---|---|---|---|
Vehicle repair CPI | 5.8% | 8.1% (adverse for insurers) (7.4% to 9.4%) | 6.6% (5.5% to 9.1%) | 5.2% (3.8% to 9.8%) |
Parts and equipment CPI | 0.8% (favorable for insurers) | 1.4% (favorable for insurers) (0.1% to 2.6%) | 2.3% (-1.5% to 4.6%) | 1.6% (-5.0% to 5.7%) |
Used vehicles CPI | -1.5% (favorable for insurers) | 0.6% (-4.5% to 4.4%) | 0.6% (-7.2% to 9.1%) | 0.0% (-12.4% to 11.2%) |
Hospital services CPI | 5.4% (adverse for insurers) | 5.1% (adverse for insurers) (4.0% to 6.1%) | 5.0% (2.8% to 6.5%) | 5.1% (2.4% to 6.5%) |
Physicians' services CPI | 2.1% | 2.3% (1.5% to 3.0%) | 1.7% (-0.1% to 3.0%) | 2.1% (-0.6% to 3.9%) |
Medical care CPI | 1.5% | 1.6% (0.8% to 2.3%) | 1.8% (-0.2% to 3.4%) | 2.2% (-0.8% to 4.5%) |
Legal services PPI | 7.4% (adverse for insurers) | 8.4% (adverse for insurers) (7.3% to 10.5%) | 4.0% (2.3% to 6.8%) | 5.7% (4.2% to 9.0%) |
Construction materials PPI | 11.0% (adverse for insurers) | 12.0% (adverse for insurers) (10.1% to 14.5%) | 8.5% (3.4% to 13.8%) | 7.4% (-4.2% to 17.5%) |
Construction wages | 4.0% | 3.6% (3.0% to 4.3%) | 3.9% (3.5% to 5.3%) | 3.6% (3.2% to 5.8%) |
Sources: [1][2][3][15]. Inaza forecasts. Ranges are 80%.
What drives these numbers:
- Repair peaks in December, then eases. December 2025 was a weak month for the repair index (439.8, down from 445.3 in November), so the year-on-year rate jumps in December 2026 on that base alone [1]. After that, repair inflation settles at about 5% by the end of 2027. Parts stay close to flat. Labor and calibration, not parts, carry repair costs.
- Legal costs ease on paper, not in level. The legal services index jumped from 316.1 in December 2025 to 336.5 in February 2026 [2]. When those months drop out of the comparison, the annual rate falls to about 4% in mid 2027. The level stays high and the rate climbs back toward 6% by December 2027.
- Hospital costs stay near 5%. Hospital services inflation has run between 3.2% and 7.9% since January 2023, and our range stays inside that band [1]. Headline medical CPI, at about 2%, understates injury claim costs.
- Used vehicle prices are the wild card. They set total loss values and are the most volatile series here. The range for December 2027 runs from -12.4% to +11.2%.
- Construction materials cool but stay above wages. Materials inflation should ease from 12.0% in December 2026 to about 7% by late 2027, with a very wide range. Construction wages are steadier at 3.6% to 3.9% [3][15].
By line. We combine these into one claim cost basket per line. Weights are set out in the methodology.
Claim cost basket (YoY) | Dec 2026 | Jun 2027 | Dec 2027 |
|---|---|---|---|
Personal auto | 6.6% (adverse for insurers) (5.8% to 7.7%) | 5.0% (adverse for insurers) (4.0% to 7.3%) | 4.3% (adverse for insurers) (3.0% to 8.2%) |
Commercial auto | 6.3% (adverse for insurers) (5.7% to 7.0%) | 4.5% (adverse for insurers) (3.7% to 6.2%) | 4.4% (adverse for insurers) (3.4% to 6.9%) |
Commercial property (rebuild cost) | 7.9% (adverse for insurers) (6.9% to 9.2%) | 6.2% (adverse for insurers) (3.5% to 9.1%) | 5.6% (adverse for insurers) (0.5% to 12.4%) |
3.2 Frequency
Persons injured in reportable crashes per 100 million vehicle miles, with 80% forecast range
Fuente: TxDOT Crash Facts 2016 to 2025 and TxDOT VMT; Inaza log-linear trend model, a fecha de October 30, 2026
Miles driven. Texas drove 314.0 billion vehicle miles in 2025, up 1.79% [10]. U.S. miles for January to August 2026 were 0.53% above the same months of 2025 [13]. Texas mileage grew faster than U.S. mileage in 17 of the 22 years from 2004 to 2025 [10][13], so we forecast Texas from the U.S. figure with a simple regression on 2004 to 2025 (excluding 2020 and 2021). Our forecast for 2026 is 317 billion miles (311.5 to 323 billion), growth of 1.1% (-0.8% to +3.0%). For 2027 we expect 321 billion (310 to 331 billion).
Injury rate. TxDOT counted 244,534 people injured in reportable crashes in 2025, or 77.9 per 100 million miles [12]. That rate has fallen about 2.1% a year since 2016 (80% confidence: 1.9% to 2.4% a year), excluding 2020 [12]. We forecast 76.9 (favorable for insurers) in 2026 (74.5 to 79.4) and 75.3 (favorable for insurers) in 2027 (72.8 to 77.9).
What it means for claims. Fewer injuries per mile and modestly more miles leave the number of injured people roughly flat: about 244,000 in 2026 (235,000 to 253,000) and 242,000 in 2027 (230,000 to 253,000). Per mile driven, we expect injury crash frequency to fall about 2.1% (favorable for insurers) in 2027 (range -5.3% to +1.2%). That helps the loss ratio, but it offsets only a third to a half of the severity trend in section 3.1.
The 2025 fatality rate of 1.20 per 100 million miles was the lowest in our 2016 to 2025 series [10]. One good year is not a trend, so we do not forecast a further drop in deaths. We use the injury rate, which tracks claim counts more closely.
3.3 Catastrophe and weather
Texas hail reports per quarter: central outlook and 80% range, against the 2016 to 2025 average
Fuente: NOAA SPC severe weather database 2016 to 2025 and SPC preliminary reports for 1 to 31 Oct 2026; Inaza analysis, a fecha de October 30, 2026
A very strong El Niño. NOAA's Climate Prediction Center expects the current El Niño to strengthen further, with an 80% chance of at least a strong event lasting through January to March 2027 [19]. The Oceanic Niño Index reached +2.16 for July to September 2026 [20]. For November to January, CPC favors above-normal precipitation across the central and southern Plains and equal chances of above, near or below normal temperatures over parts of the southern Plains [19].
Hail: plan on a normal spring, which is a big one. We tested whether El Niño changes Texas hail counts. We fit a regression of Texas hail reports on the winter El Niño index and a time trend for 1996 to 2025 [5][20]. The El Niño effect was close to zero: -1% per degree for Q1 (80% confidence: -13% to +12%) and -1% for Q2 (-6% to +3%). The three strong El Niño winters in that period gave Q1 counts of 474 (1998), 244 (2016) and 199 (2024) [5]. So we base the hail outlook on 2016 to 2025.
Texas hail reports | Central | 80% range | 2016 to 2025 average |
|---|---|---|---|
Q4 2026, all hail | 34 (favorable for insurers) | 15 to 57 | 42.6 |
Q4 2026, 2 inches or larger | 5.5 (adverse for insurers) | 5 to 11 | 3.6 |
Q1 2027, all hail | 200 | 121 to 258 | 190.4 |
Q1 2027, 2 inches or larger | 20 | 4 to 28.5 | 19.1 |
Q2 2027, all hail | 1,004 | 622 to 1,308 | 994.3 |
Q2 2027, 2 inches or larger | 170.5 | 84.5 to 260 | 168.6 |
Q4 2026 adds October's preliminary count (11 hail reports for the full month, 5 of them 2 inches or larger) to November and December outcomes from 2016 to 2025 [4][5]. Q1 and Q2 2027 use the median and the 10th to 90th percentile of 2016 to 2025 [5].
Texas hail reports, January to March
Fuente: NOAA SPC severe weather database 2016-2025, a fecha de December 31, 2025
Q2 is when Texas hail losses happen. April to June has averaged about five times as many hail reports as January to March [5]. Large hail of 2 inches or more, the size that damages roofs and vehicles, averaged 168.6 reports in Q2 [5]. One large hail event over a major metro area can outweigh the rest of the quarter.
Hurricane season close-out. No hurricane made landfall in Texas in 2026 through 30 October. Tropical storms Arthur in June and Edouard in early September brought heavy rain and flooding to southeast Texas [22]. In our scan of NOAA's HURDAT2 landfall records for 1851 to 2025, no tropical storm or hurricane has come ashore on the Texas coast after 17 October [21]. The latest hurricane landfalls were on 16 October, in 1912 and 1989 [21]. We put the chance of a Texas landfall before the season ends on 30 November at close to zero.
Flood. July flooding was extreme in both 2025 and 2026 [6]. With CPC favoring a wetter than normal winter in the southern Plains, we would expect more flood and wet-road claims than a typical winter. We do not put a number on this. Flood claim counts depend on where rain falls more than on seasonal totals.
3.4 Premium and rate trend
Price indexes tell the same story from three angles. Claim costs are rising faster than premiums for all three lines.
Price measure (YoY) | Latest (Sep 2026) | Dec 2026 | Dec 2027 |
|---|---|---|---|
Motor vehicle insurance CPI | -5.0% | -4.8% (-6.5% to -2.0%) | -0.2% (-9.1% to 11.8%) |
Private passenger auto insurance PPI | 0.7% | 0.6% (-0.3% to 2.1%) | 1.6% (-3.3% to 8.4%) |
Commercial auto insurance PPI | -1.2% | -1.1% (-2.5% to 0.6%) | 0.1% (-3.4% to 5.5%) |
Commercial multiple peril insurance PPI | 3.4% | 2.1% (0.8% to 3.9%) | 3.2% (2.2% to 9.8%) |
Sources: [1][14]. Inaza forecasts using the same method as section 3.1.
Year-on-year change, %, with 80% forecast range to December 2027
Fuente: Inaza model on BLS CPI and PPI data (api.bls.gov): CPI repair, used vehicles, hospital and physicians' services, motor vehicle insurance; PPI offices of lawyers. Basket weights in the methodology, a fecha de October 30, 2026
Texas personal auto filings point to a turn. TDI's statewide average personal auto rate change was +4.8% in 2024 and +0.9% in 2025 [17]. In TDI's rate filing data, personal auto filings received from January to 30 October 2026 had a median change of +0.5%, and 56% were increases [16]. That compares with -0.1% and 50% in 2025 [16]. The 42 filings with renewal effective dates in Q4 2026 had a median change of +2.1%, and 71% were increases [16]. These are counts of filings, not weighted by premium, so they show direction rather than the market average.
Our read. Personal auto prices bottom out in Q4 2026 and start to rise in 2027, but slowly. The ranges are wide because insurance price indexes swing with the underwriting cycle. Commercial property premiums keep rising at about 3%, behind rebuild costs.
3.5 Regulatory items with known dates
Date | Item | Lines | Status at 13 Nov 2026 |
|---|---|---|---|
28 May 2026 | TxDMV authorization required for commercial automated vehicle operators (SB 2807) | Commercial auto | In force [9] |
15 Oct 2026 | TDI adds personal auto nonrenewal and declination reasons to its HB 2067 ZIP code tool | Personal auto | Live [26] |
24 Nov 2026 | SB 458 appraisal rules (28 TAC 5.9800 to 5.9806) take effect | Personal auto, residential property | Adopted 6 Nov 2026 [11][25] |
30 Nov 2026 | Atlantic hurricane season ends | Commercial property, auto physical damage | Scheduled |
12 Jan 2027 | 90th Texas Legislature convenes | All lines | Scheduled [23] |
1 Mar 2027 | SB 458 appraisal rules apply to policies delivered, issued for delivery or renewed from this date | Personal auto, residential property | Adopted [25] |
31 May 2027 | Regular session ends (140-day limit) | All lines | Scheduled [24] |
What we expect. Claim costs and litigation will be on the 2027 session agenda. Senate Bill 30, which would have limited medical damages evidence in injury suits, failed in 2025, and TDI's Speak Up, Texas participants named affordability and claims handling as their top problems. We cannot forecast the outcome of any bill. We do expect the SB 458 appraisal workflow to be the first new compliance cost in 2027.
4. What it means for loss ratio and combined ratio
Combined ratio is loss ratio plus expense ratio. We estimate the loss ratio effect of 12 months of cost, frequency and price trends for each line, using the forecasts above. We apply that to each line's 2024 Texas loss ratio from TDI, the latest available [18]. This is a trend estimate, not a loss ratio forecast. It leaves out catastrophe losses, reserve changes and the lag between rate changes and earned premium. If expense ratios hold, the combined ratio moves by the same number of points.
Change in loss ratio points from 12 months of cost, frequency and price trends, central and 80% range
Fuente: Inaza model on BLS, TxDOT and TDI data. Base loss ratios: TDI 2025 annual report on market conditions (2024 earned to incurred), a fecha de October 30, 2026
Line | 2024 Texas loss ratio | 12 months to Dec 2026 | 12 months to Dec 2027 | Chance of a rise, 2027 |
|---|---|---|---|---|
Personal auto | 65.6% | +4.0 points (adverse for insurers) (+0.7 to +8.1) | +1.0 points (adverse for insurers) (-4.8 to +7.3) | 59% |
Commercial auto | 78.1% | +4.0 points (adverse for insurers) (+1.0 to +7.1) | +1.7 points (adverse for insurers) (-3.0 to +6.2) | 68% |
Commercial property | 65.7% | +3.7 points (adverse for insurers) (+2.4 to +5.0) | +0.8 points (adverse for insurers) (-3.6 to +5.4) | 59% |
Sources: Inaza model on [1][2][3][10][12][14][15]; base loss ratios from TDI [18], earned to incurred, loss adjustment expense excluded. Commercial property uses the commercial fire and allied lines ratio.
Personal auto
Loss ratio: the gap is widest now. In the 12 months to December 2026, claim costs rise 6.6% (adverse for insurers). On price, the motor vehicle insurance CPI falls 4.8% while the private passenger auto insurance PPI rises 0.6%, and the model draws equally from the two [1][14]. Frequency per mile falls about 2.1% (favorable for insurers). Together that is about 4 points (adverse for insurers) of loss ratio pressure on a 65.6% base. In 2027 the pressure shrinks to about 1 point as price indexes turn up, but the range runs from -4.8 to +7.3 points because price is so uncertain.
Expense ratio: new compliance work. The SB 458 appraisal rules, adopted on 6 November, require appraisal notices in claim decision letters and deadline tracking for policies from 1 March 2027 [25]. Since 15 October, TDI has published personal auto nonrenewal and declination reasons by ZIP code under HB 2067 [26]. Legal costs, forecast at +8.4% in December, also raise defense and loss adjustment costs [2].
Commercial auto
Loss ratio: highest base, steady pressure. Commercial auto starts from the highest loss ratio of the three lines at 78.1% [18]. Its claim cost basket rises 6.3% to December 2026, with legal services at +8.4%, while the commercial auto insurance price index falls 1.1% [2][14]. That is about 4 points of pressure. In 2027 we expect about 1.7 points, with a 68% chance of a rise.
Expense ratio: verification work. Fictitious pickups, where deception is used to obtain a shipment, made up about a quarter of U.S. and Canadian cargo theft incidents in Q3 2026 [8]. Verifying carriers and documents adds handling time. Fleets that operate alongside the 3,164 authorized automated vehicles may face new liability questions [9].
Commercial property
Year-on-year change, %, with 80% forecast range to December 2027
Fuente: Inaza model on BLS PPI construction materials (WPUSI012011), BLS average hourly earnings in construction (CEU2000000003) and BLS PPI commercial multiple peril insurance (PCU5241265241265), a fecha de October 30, 2026
Loss ratio: rebuild costs outrun premium. Our rebuild cost basket rises 7.9% to December 2026, against 2.1% for the commercial multiple peril price index [3][14][15]. That is about 3.7 points of pressure before any catastrophe losses. In 2027 it narrows to about 0.8 points, with a wide range because materials prices are volatile. Spring hail is the bigger swing factor, and it is not in these numbers.
Expense ratio: catastrophe surge. Flood and hail events bring claim volume peaks that strain adjusters and vendors.
Summary
Line | Loss ratio pressure, Q4 2026 | Loss ratio pressure, 2027 | Expense ratio pressure | Biggest operational lever |
|---|---|---|---|---|
Personal auto | High (+4.0 points (adverse for insurers)) | Low to medium (+1.0 points (adverse for insurers)) | Medium | Estimate review and injury triage |
Commercial auto | High (+4.0 points (adverse for insurers)) | Medium (+1.7 points (adverse for insurers)) | Medium | Litigation scoring and verification |
Commercial property | High (+3.7 points (adverse for insurers)) | Low to medium (+0.8 points (adverse for insurers)), plus spring hail | Medium | Valuation checks and catastrophe triage |
The point estimates come from our model. The ratings and the operational levers are our judgment.
5. Methodology
- Scores. Score = 50 + 10 × (current value minus baseline mean) ÷ baseline standard deviation. Price components use the September year-on-year change. Storm components use counts. All components have equal weight. Line scores are plain averages of the components listed for each line.
- Data cutoff. Forecasts use price indexes through September 2026, U.S. miles driven through August 2026 and SPC preliminary storm reports for the full month of October 2026.
- Missing CPI months. BLS did not publish October 2025 CPI, and some series also lack November 2025. We filled missing months by straight-line interpolation of the log index. No published figure in this report uses an interpolated value. We do not forecast body work separately because 13 of its recent months are missing.
- Cost and price forecasts. For each monthly index we average two forecasts of the log index: (1) the latest value carried forward at the average monthly change of the last 12 months, and (2) an ARIMA(p,1,q) model with drift, with p and q from 0 to 2 chosen by AIC on the full series. Ranges are the 10th to 90th percentile of the errors the same combined method made on every forecast origin from January 2012, measured in year-on-year percentage points at each horizon. History runs from January 2007.
- Claim cost baskets. Personal auto: 40% physical damage (75% vehicle repair CPI, 25% used vehicles CPI), 30% liability vehicle damage (vehicle repair CPI) and 30% injury. Commercial auto: 15% physical damage, 25.5% liability vehicle damage and 59.5% injury. The physical damage and liability shares follow Texas direct losses paid in 2025 [18]. The 50/50 split of personal auto liability between vehicle damage and injury, and 30/70 for commercial auto, are our assumptions. Injury is an equal mix of hospital services CPI, physicians' services CPI and legal services PPI. Commercial property rebuild cost is half construction materials PPI and half average hourly earnings in construction.
- Frequency. Texas miles driven growth = 0.43 + 1.66 × U.S. growth (2004 to 2025, excluding 2020 and 2021; R² 0.66). U.S. 2026 growth is the January to August year-to-date growth, with uncertainty from how far full-year growth has differed from January to August growth since 2012. The injury rate forecast is a log-linear trend on 2016 to 2025, excluding 2020 (R² 0.94), with an 80% prediction interval.
- Hail. Counts are Texas hail reports in the SPC severe weather database. The El Niño test is a negative binomial regression of quarterly counts on a time trend and the December to February Oceanic Niño Index, 1996 to 2025. Outlook ranges are the 10th to 90th percentile of 2016 to 2025.
- Hurricanes. Texas landfalls are HURDAT2 landfall records ("L") for tropical storms and hurricanes between 97.6°W and 93.75°W and 25.8°N to 30.2°N.
- Loss ratio pressure. Change = base loss ratio × [(1 + severity) × (1 + frequency) ÷ (1 + price) - 1]. Severity is the line's claim cost basket. Frequency is the per-mile injury trend for the auto lines and zero for commercial property. Price is the line's insurance price index; personal auto draws equally from the CPI and PPI measures. We combine the ranges by simulation (50,000 draws), treating each forecast as independent. Real outcomes are often correlated, so the true range may be wider.
- Limits. Most cost and price indexes are national. Storm report counts measure meteorological activity, not insured losses. Filing counts are not premium-weighted. Nothing in this report uses Inaza client data.
Recibe un aviso cuando algo cambie en este mercado.
SuscribirseHow Inaza can help
The actions in this report can be run with your own teams and tools. Where volume makes manual checks hard, Inaza can take on the routine work:
- Re-base injury reserves on legal and hospital costs. Apply new factors at FNOL and flag open claims reserved below the current trend, including injury claims and open July flood claims in the declared counties.
- Track the gap between personal auto claim costs and price. Compare claim cost trends with earned premium by segment each month and alert when the gap widens.
- Plan Q2 2027 hail capacity for the 90th percentile. Estimate likely claim volume by county from SPC reports matched to your exposure, and agree adjuster and repair capacity before March.
- Check commercial property insured values against the rebuild-cost forecast. Flag renewals where insured values lag current rebuild costs.
- Prepare for the SB 458 appraisal rules before 1 March 2027. Detect appraisal demands in correspondence, start the clocks and insert the notice.
To see how this would work on your own book, talk to the Inaza team.
Sources
- 1. U.S. Bureau of Labor Statistics, CPI-U not seasonally adjusted (series CUUR0000SETD, SETD01, SETC, SETA02, SAM, SEMD, SEMC01, SETE, SA0, CUURS37ASAM). Data through Sep 2026. https://data.bls.gov/timeseries/CUUR0000SETD
- 2. BLS PPI Offices of Lawyers (PCU541110541110), via FRED. https://fred.stlouisfed.org/series/PCU541110541110 Data through Sep 2026.
- 3. BLS PPI Construction materials (WPUSI012011), via FRED. https://fred.stlouisfed.org/series/WPUSI012011 Data through Sep 2026.
- 4. NOAA Storm Prediction Center, daily filtered storm reports, July to October 2026 (preliminary). https://www.spc.noaa.gov/climo/reports/
- 5. NOAA Storm Prediction Center, severe weather database: hail 1955 to 2025, wind and tornado 2016 to 2025. https://www.spc.noaa.gov/wcm/
- 6. NOAA NCEI, Storm Events Database, 2026 details file (data through July 2026) and 2016 to 2025 files. https://www.ncei.noaa.gov/pub/data/swdi/stormevents/csvfiles/
- 7. OpenFEMA, Disaster Declarations Summaries v2, Texas. https://www.fema.gov/api/open/v2/DisasterDeclarationsSummaries
- 8. Verisk CargoNet, Q3 2026 cargo theft trends, news release, 4 Nov 2026. https://www.cargonet.com/news-and-events/cargonet-in-the-media/2026-q3-theft-trends/
- 9. TxDMV, Automated Motor Vehicle Authorization Program, Company and Vehicle Summary Report, 29 Oct 2026. https://www.txdmv.gov/sites/default/files/body-files/AV_Program_Report_10292026.pdf
- 10. TxDOT, Comparison of Motor Vehicle Traffic Deaths 2003 to 2025. https://www.txdot.gov/content/dam/docs/division/trf/crash-records/final-compares-2003-2025.pdf Data as of 7 Apr 2026.
- 11. TDI, Proposed and Adopted Rules for 2026. https://www.tdi.texas.gov/rules/2026/index.html
- 12. TxDOT, Texas Motor Vehicle Traffic Crash Facts, calendar years 2016 to 2025 (persons injured). https://www.txdot.gov/data-maps/crash-reports-records/motor-vehicle-crash-statistics.html
- 13. U.S. Federal Highway Administration, Traffic Volume Trends, vehicle miles traveled (TRFVOLUSM227NFWA), via FRED. https://fred.stlouisfed.org/series/TRFVOLUSM227NFWA Data through Aug 2026.
- 14. BLS PPI, direct property and casualty insurers: private passenger auto (PCU5241265241261), commercial auto (PCU5241265241263) and commercial multiple peril (PCU5241265241265). https://www.bls.gov/ppi/ Data through Sep 2026.
- 15. BLS Current Employment Statistics, average hourly earnings of all employees, construction (CEU2000000003). https://www.bls.gov/ces/ Data through Sep 2026.
- 16. TDI, Home and auto rate filings, Texas Open Data Portal. https://data.texas.gov/dataset/Home-and-auto-rate-filings/iubg-btfs Filings received to 30 Oct 2026.
- 17. TDI, Auto and home insurance rate changes, 22 Jan 2026. https://www.tdi.texas.gov/blog/auto-and-home-insurance-rate-changes.html
- 18. TDI, 2025 Annual Report on market conditions for property and casualty lines. https://www.tdi.texas.gov/reports/pc/documents/pcalr2025.pdf
- 19. NOAA Climate Prediction Center, Prognostic Discussion for Long-Lead Seasonal Outlooks, 15 Oct 2026. https://www.cpc.ncep.noaa.gov/products/predictions/long_range/fxus05.html
- 20. NOAA Climate Prediction Center, Oceanic Niño Index. https://www.cpc.ncep.noaa.gov/data/indices/oni.ascii.txt
- 21. NOAA National Hurricane Center, HURDAT2 Atlantic best track data 1851 to 2025. https://www.nhc.noaa.gov/data/hurdat/
- 22. NOAA National Hurricane Center, 2026 Atlantic advisory archive. https://www.nhc.noaa.gov/archive/2026/
- 23. Legislative Reference Library of Texas, Sessions and years (90th Regular Session, 12 Jan to 31 May 2027). https://lrl.texas.gov/sessions/sessionyears.cfm
- 24. Texas Constitution, Article III, Section 24. https://statutes.capitol.texas.gov/Docs/CN/htm/CN.3.htm
- 25. TDI, Commissioner's Order 2026-10210, adopted 28 TAC 5.9800 to 5.9806 (appraisal requirements), issued 6 November 2026. https://www.tdi.texas.gov/rules/2026/documents/202610210.pdf
- 26. Texas Department of Insurance, TDI adds auto data to transparency tool showing why policies are declined, canceled, or not renewed, news release, 15 Oct 2026. https://www.tdi.texas.gov/news/2026/tdi10152026.html
Suscríbete a Inaza Insights
Recibe los informes mensuales, la perspectiva trimestral y las alertas en vivo por email.